
创建具有多行和多色调的海运线图
创建具有多行和多色调的海运线图
提问于 2021-04-21 14:48:38
我有来自多行的数据,我想要创建海运线图。
每个iteration_value都有:
floats
- y_values-列表在0到1
- 行_标题之间的列表-色调的字符串。
我有这样的代码:
def save_graph(properties):
    plt.figure()
    for iteration_values in properties.iteration_values:
        sns_plot = sns.lineplot(iteration_values.x_values, iteration_values.y_values,
                                hue=iteration_values.line_title)

    plt.xlabel = properties.x_label
    plt.ylabel = properties.y_label

    plt.title(properties.title, fontsize=20)
    plt.ylim(0, 1)

    figure.savefig(file_path)

    plt.close()

iteration_values = [GraphIterationValues([1, 2, 3], [0.1, 0.2, 0.3], "first line title"),
                    GraphIterationValues(
                        [1, 2, 3], [0.2, 0.3, 0.4], "second line title"),
                    GraphIterationValues(
                        [1, 2, 3], [0.3, 0.4, 0.5], "third line title"),
                    GraphIterationValues([1, 2, 3], [0.4, 0.5, 0.6], "fourth line title")]

properties = OutputGraphPropertied(
    iteration_values, "x label", "y label", "plot title", "./output.jpeg")
save_graph(properties)
但我发现了错误:
ValueError: Could not interpret value `first line title` for parameter `hue`这些是属性类:
class OutputGraphPropertied:
def __init__(self, graph_iteration_values, x_label, y_label, title, file_path):
self.graph_iteration_values = graph_iteration_values
self.x_label = x_label
self.y_label = y_label
self.title = title
self.file_path = file_path
class GraphIterationValues:
def __init__(self, x_values, y_values, line_title):
self.x_values = x_values
self.y_values = y_values
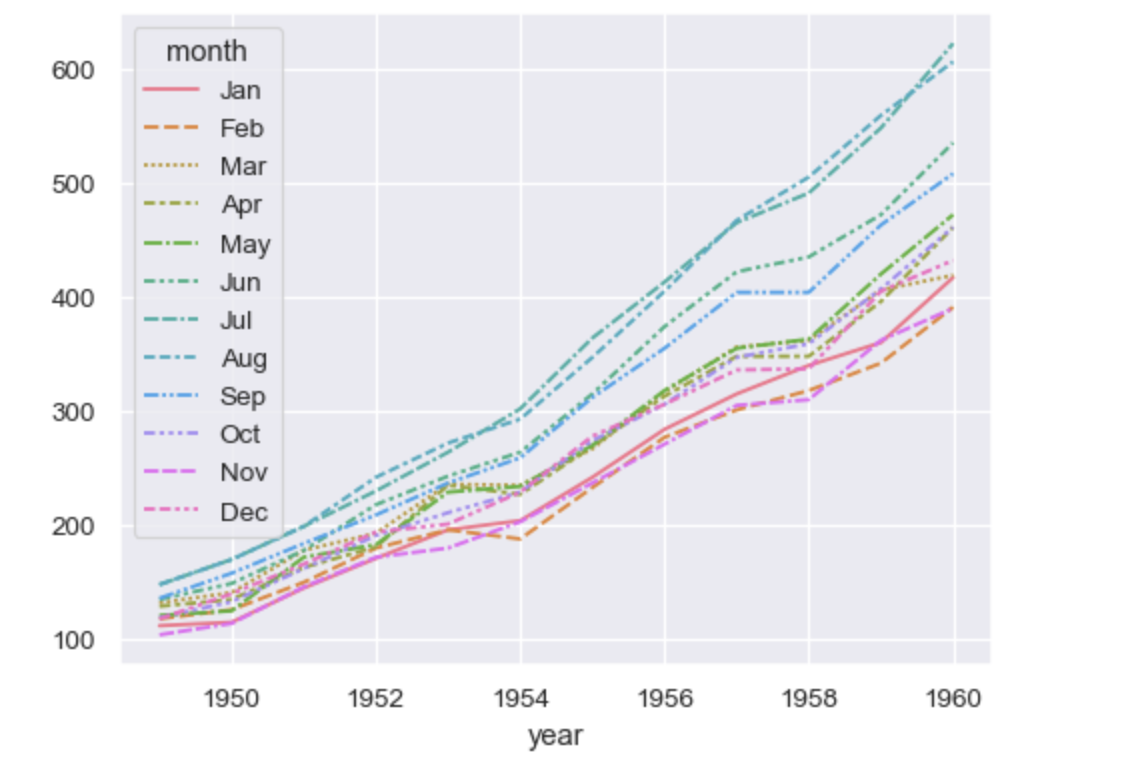
self.line_title = line_title我试着用几个月的时间让它看起来像这个情节(我用这张图片来解释):
回答 1
Stack Overflow用户
回答已采纳
发布于 2021-04-21 16:58:24
要使hue正常工作,应立即提供所有数据。此外,hue应该引用与x和y长度相同的数组,因此重复x和y值数组中每个条目的行标题。
下面是对save_graph前几行的可能调整
import matplotlib.pyplot as plt
import seaborn as sns
import numpy as np

def save_graph(properties):
    plt.figure()
    x_values = np.concatenate([iteration_values.x_values
                               for iteration_values in properties.graph_iteration_values])
    y_values = np.concatenate([iteration_values.y_values
                               for iteration_values in properties.graph_iteration_values])
    line_titles = np.concatenate([[iteration_values.line_title] * len(iteration_values.x_values)
                                  for iteration_values in properties.graph_iteration_values])
    sns_plot = sns.lineplot(x=x_values, y=y_values, hue=line_titles)
    ...

另一种选择是在同一图上绘制多个绘图,而不是使用hue,而是设置label。
def save_graph(properties):
    plt.figure()
    ax = None
    for iteration_values in properties.iteration_values:
        ax = sns.lineplot(x=iteration_values.x_values, y=iteration_values.y_values,
                                label=iteration_values.line_title, ax=ax)
    ...
这将循环通过当前的颜色周期,并创建正确的图例。
页面原文内容由Stack Overflow提供。腾讯云小微IT领域专用引擎提供翻译支持
原文链接:
https://stackoverflow.com/questions/67198205
复制相关文章
相似问题
腾讯云开发者
