
peak_widths w.r.t到x轴
peak_widths w.r.t到x轴
提问于 2021-03-03 20:05:33
我使用scipy.signal计算不同峰的宽度。我有100个值wrt到不同的时间点。我使用下面的代码计算峰值,然后计算宽度。问题是在计算宽度时不考虑x轴上的时间。
peaks_control, _ = find_peaks(x_control, height=2100)
time_control     = time[:100]
width_control    = peak_widths(x_control, peaks_control, rel_height=0.9)
width_control的输出是
数组(12.84785714,13.21299534,13.4502381,12.71311143), 数组(2042.5,2048.8,2057.4,2065 )。), 数组( 5.795 ,28.29469697,51.245,74.17150396), 数组(18.64285714,41.50769231,64.6952381,86.88461538)
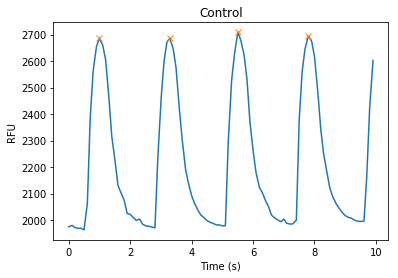
我用下面的时间在x轴上显示信号,这是正确的。
plt.plot(time_control, x_control)
plt.plot(time_control[peaks_control], x_control[peaks_control], "x")
#plt.plot(np.zeros_like(x_control), "--", color="gray")
#plt.xlim(time_control.tolist())
plt.title('Control')
plt.xlabel('Time (s)')
plt.ylabel('RFU')
plt.show()
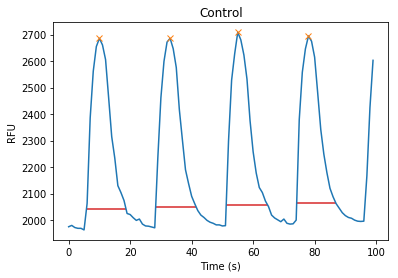
我使用下面的代码也显示宽度,但不能将实际时间放在x轴上。
plt.plot(x_control)
plt.plot(peaks_control, x_control[peaks_control], "x")
plt.hlines(*width_control[1:], color="C3")

plt.title('Control')
plt.xlabel('Time (s)')
plt.ylabel('RFU')
plt.show()
回答 1
Stack Overflow用户
发布于 2022-05-05 09:59:00
我刚才也遇到了同样的问题,下面是我的解决方案(可能有更优雅的解决方案,但这对我有用):
peak_widths()返回计算宽度的宽度(以样本为单位)、计算宽度的高度以及水平线在相应的计算高度(也在样本中)的左右交点的插值位置。
要将这些值从样本转换回x轴,我们可以使用scipy.interpolate.interp1()。
from scipy.signal import find_peaks, peak_widths
from scipy.interpolate import interp1d
import matplotlib.pyplot as plt
import numpy as np

def index_to_xdata(xdata, indices):
    "interpolate the values from signal.peak_widths to xdata"
    ind = np.arange(len(xdata))
    f = interp1d(ind,xdata)
    return f(indices)

x = np.linspace(0, 1, 10)
y = np.sin(4*x-0.2)

peaks, _ = find_peaks(y)
widths, width_heights, left_ips, right_ips = peak_widths(y, peaks)

widths = index_to_xdata(x, widths)
left_ips = index_to_xdata(x, left_ips)
right_ips = index_to_xdata(x, right_ips)

plt.plot(x,y)
plt.plot(x[peaks], y[peaks], "x")
plt.hlines(width_heights, left_ips, right_ips, color='r')
plt.xlabel('x values')
plt.ylabel('y values')
plt.show()
页面原文内容由Stack Overflow提供。腾讯云小微IT领域专用引擎提供翻译支持
原文链接:
https://stackoverflow.com/questions/66464148
复制相关文章
相似问题
腾讯云开发者
