
STM32CubeIDE和OpenOCD:错误:等待目标停止时超时
STM32CubeIDE和OpenOCD:错误:等待目标停止时超时
提问于 2021-02-20 21:43:08
硬件/IDE上下文:
- 零件/板:正版STM32F103C8 (BluePill)
- 程序员: ST-Link V2
- IDE:完全更新的Windows 10上的STM32CubeIDE 1.5.1
- 闪烁实用程序/调试器: OpenOCD
在试图在我的BluePill板上构建/闪存一个简单的BluePill LED闪烁程序时,我遇到了OpenOCD的错误,如下所示:
Open On-Chip Debugger 0.10.0+dev-01288-g7491fb4 (2020-10-27-17:36)
Licensed under GNU GPL v2
For bug reports, read
    http://openocd.org/doc/doxygen/bugs.html
Info : Listening on port 6666 for tcl connections
Info : Listening on port 4444 for telnet connections
Info : STLINK V2J37S7 (API v2) VID:PID 0483:3748
Info : Target voltage: 3.256346
Info : Unable to match requested speed 8000 kHz, using 4000 kHz
Info : Unable to match requested speed 8000 kHz, using 4000 kHz
Info : clock speed 4000 kHz
Info : stlink_dap_op_connect(connect)
Info : SWD DPIDR 0x1ba01477
Info : STM32F103C8Tx.cpu: hardware has 6 breakpoints, 4 watchpoints
Info : STM32F103C8Tx.cpu: external reset detected
Info : starting gdb server for STM32F103C8Tx.cpu on 3333
Info : Listening on port 3333 for gdb connections
Info : accepting 'gdb' connection on tcp/3333
Error: timed out while waiting for target halted
Error executing event gdb-attach on target STM32F103C8Tx.cpu:
TARGET: STM32F103C8Tx.cpu - Not halted
Info : device id = 0x20036410
Info : flash size = 64kbytes
Info : accepting 'gdb' connection on tcp/3333
Error: timed out while waiting for target halted
Error executing event gdb-attach on target STM32F103C8Tx.cpu:
TARGET: STM32F103C8Tx.cpu - Not halted
Error: timed out while waiting for target halted
Error executing event gdb-flash-erase-start on target STM32F103C8Tx.cpu:
TARGET: STM32F103C8Tx.cpu - Not halted
Error: Target not halted
Error: failed erasing sectors 0 to 5
Error: flash_erase returned -304
shutdown command invoked
Info : dropped 'gdb' connection
shutdown command invoked我有兴趣在我的项目中使用基于OpenOCD的闪烁来利用我周围的一些STM32F103C8克隆板,但是当我将STM32CubeIDE中的闪烁模式/“调试探针”从ST-Link (OpenOCD)切换回ST-Link (ST-Link GDB Server)时,上传过程再次工作。
这对我来说是一个奇怪的错误,特别是因为我特别记得这个精确的配置(STM32CubeIDE + OpenOCD + ST-Link + STM32F103C8)是在几个月前开始工作的。有没有人知道这是由什么引起的?我有OpenOCD调试器来使用标准的自动生成的配置文件。
此外,请告诉我,如果有更多的信息/细节,您将需要帮助诊断这个问题。我很乐意提供任何必要的东西。
编辑2/22/2021:
下面是自动生成(由STM32CubeIDE) OpenOCD .cfg文件的副本:
# This is an genericBoard board with a single STM32F103C8Tx chip
#
# Generated by STM32CubeIDE
# Take care that such file, as generated, may be overridden without any early notice. Please have a look to debug launch configuration setup(s)

source [find interface/stlink-dap.cfg]


set WORKAREASIZE 0x5000

transport select "dapdirect_swd"

set CHIPNAME STM32F103C8Tx
set BOARDNAME genericBoard

# Enable debug when in low power modes
set ENABLE_LOW_POWER 1

# Stop Watchdog counters when halt
set STOP_WATCHDOG 1

# STlink Debug clock frequency
set CLOCK_FREQ 8000

# Reset configuration
# use hardware reset, connect under reset
# connect_assert_srst needed if low power mode application running (WFI...)
reset_config srst_only srst_nogate connect_assert_srst
set CONNECT_UNDER_RESET 1
set CORE_RESET 0

# ACCESS PORT NUMBER
set AP_NUM 0
# GDB PORT
set GDB_PORT 3333


# BCTM CPU variables

source [find target/stm32f1x.cfg]

#SWV trace
tpiu config disable Stack Overflow用户
回答已采纳
发布于 2021-03-23 23:06:14
最终,经过进一步的研究和尝试与错误,我最终确定了一个似乎对我有用的解决方案。我注意到,当中断CPU的错误出现时,正确的程序似乎已经加载,重置按钮只需要手动切换。这些是我最后确定的OpenOCD设置:
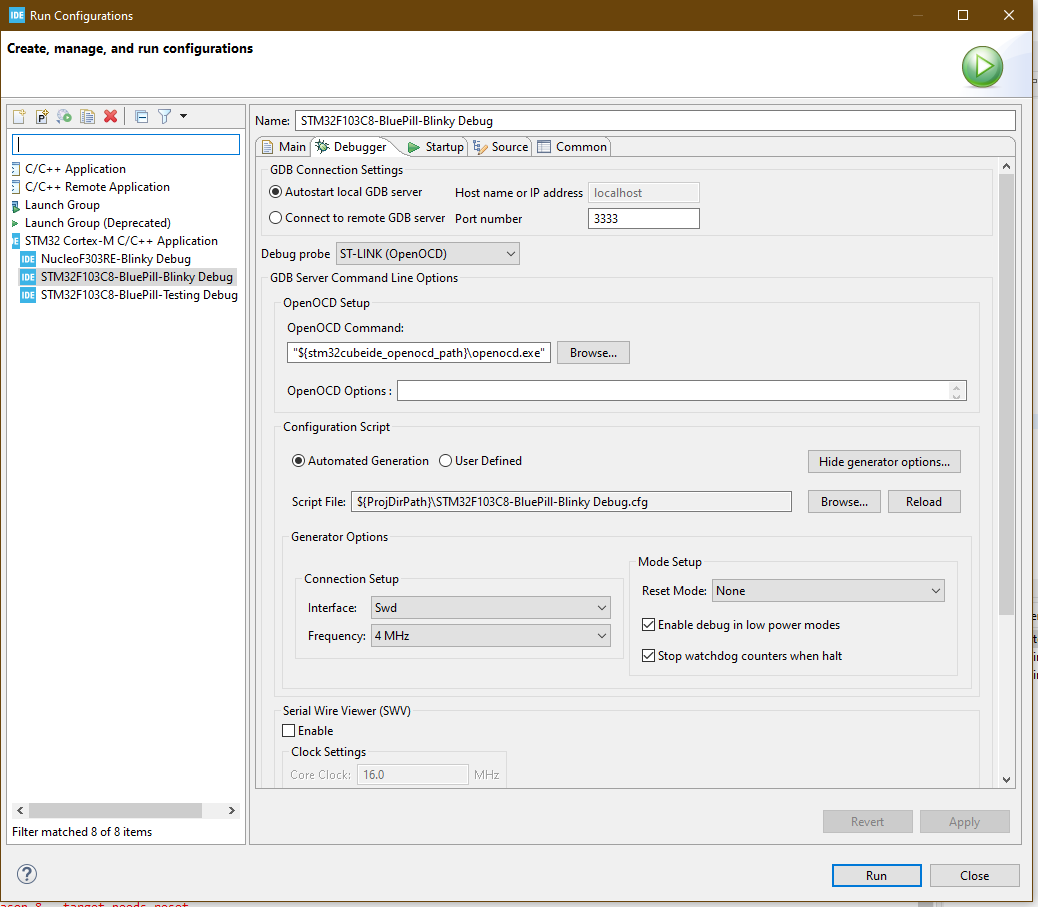
对默认配置的更改:
- 社署频率:8 MHz 4→
- 这在技术上并不是必需的,但无论如何,OpenOCD将在上传过程中自动恢复到4 MHz。
- 重置模式:在重置→无连接下连接
下面的输出适用于我:
Open On-Chip Debugger 0.10.0+dev-01288-g7491fb4 (2020-10-27-17:36)
Licensed under GNU GPL v2
For bug reports, read
    http://openocd.org/doc/doxygen/bugs.html
Info : Listening on port 6666 for tcl connections
Info : Listening on port 4444 for telnet connections
Info : STLINK V2J37S7 (API v2) VID:PID 0483:3748
Info : Target voltage: 3.254751
Info : clock speed 4000 kHz
Info : stlink_dap_op_connect(connect)
Info : SWD DPIDR 0x1ba01477
Info : STM32F103C8Tx.cpu: hardware has 6 breakpoints, 4 watchpoints
Info : STM32F103C8Tx.cpu: external reset detected
Info : starting gdb server for STM32F103C8Tx.cpu on 3333
Info : Listening on port 3333 for gdb connections
Info : accepting 'gdb' connection on tcp/3333
Info : device id = 0x20036410
Info : flash size = 64kbytes
undefined debug reason 8 - target needs reset
Info : accepting 'gdb' connection on tcp/3333
undefined debug reason 8 - target needs reset
target halted due to debug-request, current mode: Thread
xPSR: 0x01000000 pc: 0x08000474 msp: 0x20005000
target halted due to debug-request, current mode: Thread
xPSR: 0x01000000 pc: 0x08000474 msp: 0x20005000
shutdown command invoked
Info : dropped 'gdb' connection
shutdown command invoked页面原文内容由Stack Overflow提供。腾讯云小微IT领域专用引擎提供翻译支持
原文链接:
https://stackoverflow.com/questions/66296855
复制相关文章
相似问题
腾讯云开发者
