
利用specaccum()外推物种积累曲线
我正在用两种不同的调查方法观察热带雨林保护区中发现的一些两栖动物/爬行动物。我想比较一下这些方法,但是一种方法比另一种方法有更多的数据。
在研究地点内,也有三个不同的区域具有不同程度的扰动(CCR、PCR和SLR),这三个区域在两种调查方法内部和之间也有不同程度的努力。
我想为每一种方法建立两条外推物种积累曲线,一条包括所有扰动类型,另一条分裂扰动类型。
我已经成功地创建了累积曲线,但它们并不是通过观察到的个体数推断出来的。我该如何推断曲线呢?
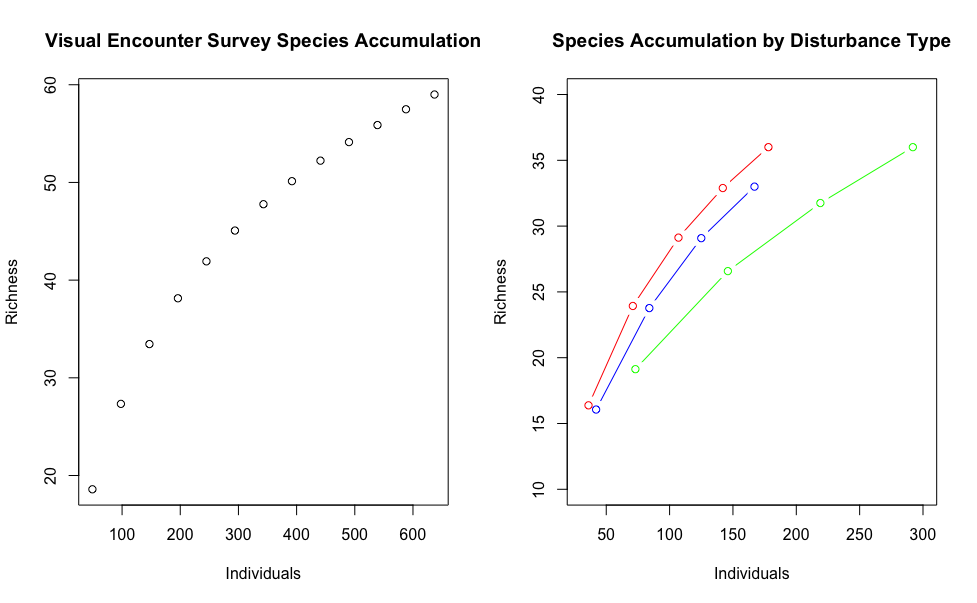
SAves <- specaccum(comm = cves[,4:ncol(cves)],  method = "rarefaction") #getting species accumulation for ves
SAvCCR <- specaccum(comm = cvCCR[,4:ncol(cves)], method = "rarefaction") #getting species accumulation for ves ccr
SAvPCR <- specaccum(comm = cvPCR[,4:ncol(cves)], method = "rarefaction") #getting species accumulation for ves pcr
SAvSLR <- specaccum(comm = cvSLR[,4:ncol(cves)], method = "rarefaction") #getting species accumulation for ves slr

par(mfrow= c(1,2))
plot(SAves[["individuals"]], y=SAves[["richness"]], xlab = "Individuals", ylab="Richness", main = "Visual Encounter Survey Species Accumulation") #plotting species accumulation curves for VES
plot(SAvSLR[["individuals"]], y=SAvSLR[["richness"]], xlab = "Individuals", ylab="Richness", main = "Species Accumulation by Disturbance Type", col = "green", type = "b", xlim = c(30,300), ylim =c(10,40))
lines(SAvCCR[["individuals"]], y=SAvCCR[["richness"]], xlab = "Individuals", ylab="Richness", col = "red", type = "b")
lines(SAvPCR[["individuals"]], y=SAvPCR[["richness"]], xlab = "Individuals", ylab="Richness", col = "blue", type = "b")


SAbox <- specaccum(comm = cbox[,4:ncol(cbox)], method = "rarefaction") #getting species accumulation for herp box
SAbCCR <- specaccum(comm = cbCCR[,4:ncol(cbox)], method = "rarefaction") #getting species accumulation for herp box ccr
SAbPCR <- specaccum(comm = cbPCR[,4:ncol(cbox)], method = "rarefaction") #getting species accumulation for herp box pcr
SAbSLR <- specaccum(comm = cbSLR[,4:ncol(cbox)], method = "rarefaction") #getting species accumulation for herp box slr

par(mfrow= c(1,2))
plot(SAbox[["individuals"]], y=SAbox[["richness"]], xlab = "Individuals", ylab="Richness", type="b") #plotting species accumulation curves for herp box
plot(SAbSLR[["individuals"]], y=SAbSLR[["richness"]], xlab = "Individuals", ylab="Richness", main = "Species Accumulation by Disturbance Type", col = "green", type = "b", ylim=c(0,35), xlim = c(8, 80))
lines(SAbCCR[["individuals"]], y=SAbCCR[["richness"]], xlab = "Individuals", ylab="Richness", col = "red", type = "b")
lines(SAbPCR[["individuals"]], y=SAbPCR[["richness"]], xlab = "Individuals", ylab="Richness", col = "blue", type = "b")
回答 1
Stack Overflow用户
发布于 2021-02-20 09:26:19
稀薄和其他specaccum工具是插值方法,没有可靠的方法来推断这些结果。然而,fitspecaccum为插值数据拟合常用的非线性模型提供了一些选择,这些拟合模型可以通过predict函数进行外推。然而,一般说来,这些模型不太适合插值数据,而且它们的推断可能也很差。这些模型中有些假设有一个渐近上限,但有些则没有,这确实影响了外推,而且其中一些结果可能会产生误导(当它们不同时,无法知道哪些模型是有效的)。
有一个叫做BNPvegan (贝叶斯非参数素食者)的包,它引入了外推稀薄。但是,包和实际方法仍在开发中,因此请谨慎行事,并遵循包中的更改。该包可通过https://github.com/alessandrozito/BNPvegan获得。
在您的案例中,典型的情况是减少适用于所有案例的个人数量。它可以是最小样本集中的个体数和两个个体(原则上也是一个个体,但这是无用的,因为你总是有一个物种和一个个体)。然而,你应该意识到,在某些情况下,稀薄曲线交叉,这样稀有财富的排序可以偶然。在你的例子中,他们似乎没有交叉,你是安全的,但始终检查这一点。
https://stackoverflow.com/questions/66242657
复制相似问题
腾讯云开发者
