
使用ggtext在标签中的两个单词之间添加空格。
使用ggtext在标签中的两个单词之间添加空格。
提问于 2021-02-14 22:36:31
我使用ggtext包格式化由ggplot2生成的绘图的轴标签,特别是函数element_textbox_simple(),并且我在html格式中有一些问题来引入空格或单词之间的空白。
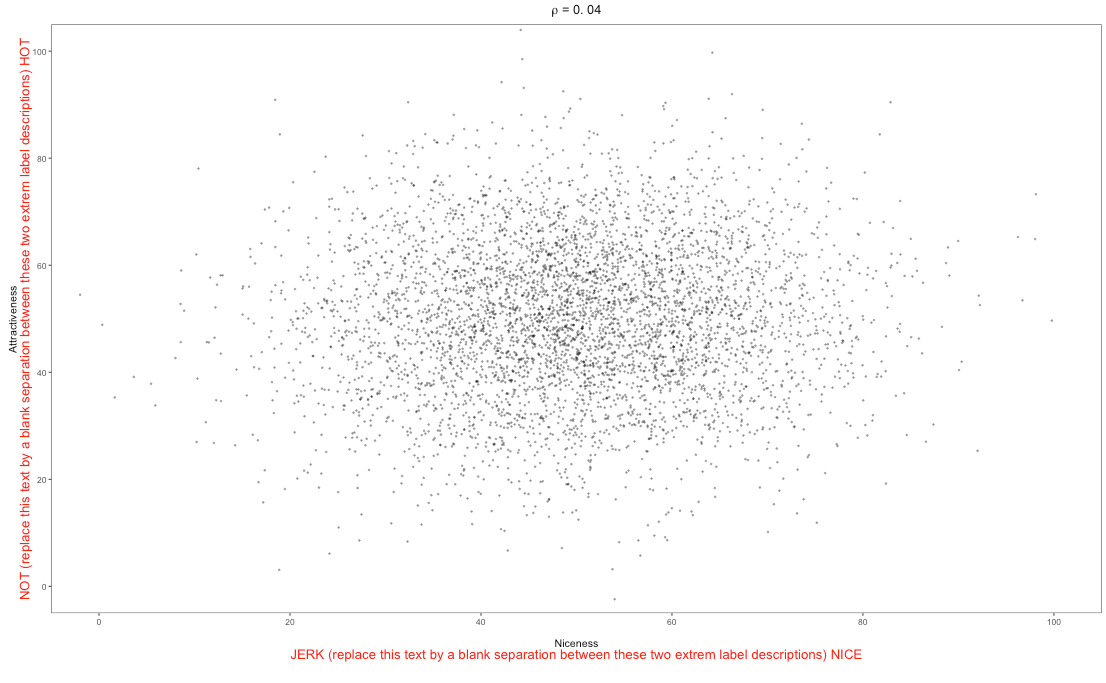
在上面的图中,每个轴标签有两个层次:
变量的
- 名称(例如,好的)
- 第二行带有标记,描述各个轴的每个极值(例如,挺举-好)
。
为了实现这个“多层次标签”,我使用ggtext将标签格式化为以下html表达式:
<br><span style = 'font-size:8pt'>Niceness</br><br><span style='word-spacing:20pt;font-size:10pt;color:red'>JERK NICE</span></br>"我的问题是属性word-spacing不工作,我需要将每个轴的“带有标记的第二行”空间到轴的极值。例如,在情节中,我想用许多空白处替换JERK和plot之间的文本。我尝试使用nbsp;,它假定编码一个空白,但没有成功,它只将两个标记分隔为一个默认空格。有什么想法吗?
你可以用以下方式再现情节:
library(ggplot2)
library(ggtext)
library(latex2exp)

# Multivariate normal dist parameters:
mu <- c(50, 50)
Sigma <- matrix(c(200, 4, 8, 200), 2)

# Generate 10.000 data points
set.seed(323)
df <- as.data.frame(MASS::mvrnorm(5e3, mu, Sigma))

# Compute correlation between V1 and V2
cor0 <- round(cor(df$V1, df$V2), 2)

# Initial plot
p0 <- df %>%
   ggplot() +
   geom_point(aes(V1, V2), alpha = .3, size = .2) +
   scale_x_continuous(breaks = seq(0, 100, 20), n.breaks = seq(0, 100, 5)) +
   scale_y_continuous(breaks = seq(0, 100, 20)) +
   coord_cartesian(xlim = c(0, 100), ylim = c(0, 100)) +
   labs(x = "<br><span style = 'font-size:8pt'>Niceness</br><br><span style='word-spacing:5pt;font-size:10pt;color:red'>JERK  (replace this text by a blank separation between these two extrem label descriptions)  NICE</span></br>",
   y = "<br><span style = 'font-size:8pt'>Attractiveness</br><br><span style = 'font-size:10pt;color:red'>NOT  (replace this text by a blank separation between these two extrem label descriptions)  HOT</span></br>",
   title = TeX(paste("$\\rho$ =", as.character(cor0)))) +
   theme_bw(base_size = 8) +
   theme(plot.title = element_text(hjust = 0.5),
         panel.grid.major = element_blank(),
         panel.grid.minor = element_blank(),
         axis.title.x = element_textbox_simple(
                          margin = margin(0, 100, 15, 100),
                          halign = 0.5
                        ),
         axis.title.y = element_textbox_simple(
                          margin = margin(0, 0, 0, 0),
                          orientation = "left-rotated",
                          halign = 0.5
))回答 2
Stack Overflow用户
回答已采纳
发布于 2021-02-15 03:44:14
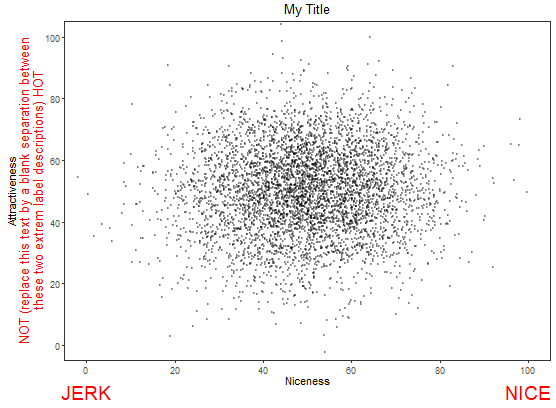
也许您只需要annotate您想要的文本,如下所示。请注意clip="OFF"中的coord_cartesian
同样,你也可以对y轴重复同样的操作。
# Initial plot
p0 <- df %>%
  ggplot() +
  geom_point(aes(V1, V2), alpha = .3, size = .2) +
  scale_x_continuous(breaks = seq(0, 100, 20), n.breaks = seq(0, 100, 5)) +
  scale_y_continuous(breaks = seq(0, 100, 20)) +
  coord_cartesian(xlim = c(0, 100), ylim = c(0, 100), expand = TRUE, clip = "off") +
  labs(# x = "<br><span style = 'font-size:8pt'>Niceness</br><br><span style='word-spacing:5pt;font-size:10pt;color:red'>JERK  (replace this text by a blank separation between these two extrem label descriptions)  NICE</span></br>",
       x = "Niceness",
       y = "<br><span style = 'font-size:8pt'>Attractiveness</br><br><span style = 'font-size:10pt;color:red'>NOT  (replace this text by a blank separation between these two extrem label descriptions)  HOT</span></br>",
       title = "My Title" #TeX(paste("$\\rho$ =", as.character(cor0)))
       ) +
  annotate(geom = "text", x = c(0,100), y = -15,
           label = c("JERK", "NICE" ), size = 5, color="red") +
  theme_bw(base_size = 8) +
  theme(plot.title = element_text(hjust = 0.5),
        panel.grid.major = element_blank(),
        panel.grid.minor = element_blank(),
        axis.title.x = element_textbox_simple(
          margin = margin(0, 100, 15, 100),
          halign = 0.5
        ),
        axis.title.y = element_textbox_simple(
          margin = margin(0, 0, 0, 0),
          orientation = "left-rotated",
          halign = 0.5
        ))
p0
Stack Overflow用户
发布于 2022-10-01 13:13:32
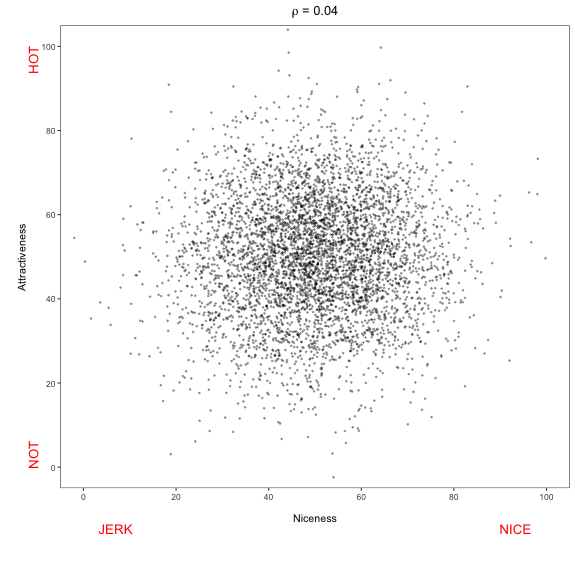
虽然注释会起作用,但我发现通过添加一系列与情节背景颜色相同的句点来使ggtext添加空白更容易(我认为通常更好看)。这可以通过更新labs()部分来完成:
labs(
     x = paste0(
         "<br><span style = 'font-size:8pt'>Niceness</br><br>",
        "<span style='word-spacing:5pt;font-size:10pt;color:red'>JERK",

        #add whitespace:
        "<span style = 'color:#ffffff;'>...................................................................................................</span>",

        "NICE</span></br>"),

     y = paste0(
         "<br><span style = 'font-size:8pt'>Attractiveness</br><br>",
         "<span style = 'font-size:10pt;color:red'>NOT",

         #add whitespace:
        "<span style = 'color:#ffffff;'>...................................................................................................</span>",


        "HOT</span></br>"),

     title = TeX(paste("$\\rho$ =", as.character(cor0))))
这会给你一个这样的情节:
页面原文内容由Stack Overflow提供。腾讯云小微IT领域专用引擎提供翻译支持
原文链接:
https://stackoverflow.com/questions/66200797
复制相关文章
相似问题
腾讯云开发者
