
Xdebug 3.0 WSL2和VSCode -配置工作
web上使用VSCode和WSL调试的大多数示例都使用Xdebug 2.x php.ini设置。这些不再适用于3.0版。有关更改的详细信息,请参阅Xdebug升级。
下面对我来说是一个PHP项目,只有一个文件才能测试调试。使用Ubuntu20.04,WSL2,Xdebug 3.02与VSCode扩展远程WSL和PHP,由Felix。
我不得不在我的系统上同时修改/etc/php/7.3/apache2/php.ini和/etc/php/7.3/cli/php.ini。希望这对你们有用。
php.ini
[xdebug]
zend_extension = ./lib/php/20180731/xdebug.so
xdebug.start_with_request = trigger
xdebug.mode = debug
xdebug.discover_client_host = 1
xdebug.log = /tmp/xdebug_remote.log
xdebug.client_port = 9003
launch.json
"configurations": [
        {
            "name": "Listen for XDebug",
            "type": "php",
            "request": "launch",
            "port": 9003,
            "stopOnEntry": true,
            "log": true,
            "pathMappings":
            {
                "/var/www/html/test": "${workspaceRoot}"
            }
        },
        {
            "name": "Launch currently open script",
            "type": "php",
            "request": "launch",
            "program": "${file}",
            "cwd": "${fileDirname}",
            "port": 9003
        }
] Stack Overflow用户
发布于 2021-06-16 16:15:15
为了补充@Jim D记录的内容:
我最初使用VSCode网络共享路径\\wsl$\Ubuntu-18.04\srv\www\myphpwebsite打开了我的WSL2工作区。没有使用这个配置--大概是因为端口9003没有从Windows转发到WSL2。
我必须使用重新打开工作区/文件夹的,使用远程- WSL扩展。为此,您可以单击VSCode状态栏(左下角)上的Remote-WSL控件,并选择“在WSL中重新打开文件夹”。在WSL2中“安装”远程-WSL大约需要10分钟。
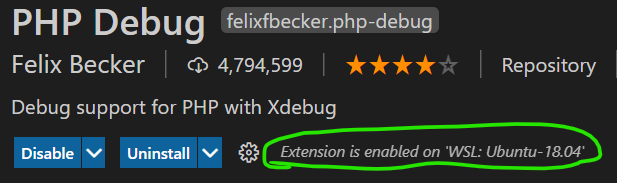
之后,我必须“安装”(或启用) PHP调试扩展,特别是在WSL:Ubuntu WSL2环境中,即使它已经安装在VSCode中。
我的launch.json配置是:
        {
            "name": "myphpwebsite",
            "type": "php",
            "request": "launch",
            "port": 9003,
            "pathMappings": {
                "/srv/www/myphpwebsite": "${workspaceRoot}"
            },
            //"stopOnEntry": true,
            //"log": true,
            "xdebugSettings": {
                "max_data": 10000,
                //"show_hidden": 1,
                "max_children": 250,
                "max_depth": 10
            }
},我的PHP7.3配置如下:在/etc/php/7.3/apache2/conf.d文件夹中,20-xdebug.ini文件是指向/etc/php/7.3/mods-available/xdebug.ini的符号链接。这是通过sudo apt install php7.3-xdebug自动配置的。它只包含:
zend_extension=xdebug.so然后,我向/etc/php/7.3/apache2/conf.d文件夹中添加了一个补充的/etc/php/7.3/apache2/conf.d文件(以确保它在20-xdebug.ini文件之后加载,并将其配置与发行版分开)。该文件包含:
xdebug.mode=debug
xdebug.start_with_request=trigger
;xdebug.start_with_request=yes
xdebug.discover_client_host=1
;xdebug.log=/tmp/xdebug/xdebug.log
xdebug.output_dir=/tmp/xdebug/
xdebug.client_port=9003
xdebug.var_display_max_depth=10
xdebug.var_display_max_children=250
xdebug.var_display_max_data=10000不要忘记在进行.ini更改后重新启动Apache。
在xdebug.start_with_request=trigger设置中,在VSCode中启动调试器之后,我使用Chrome Xdebug助手扩展触发XDebug会话。(如果使用.ini设置xdebug.start_with_request=yes,则不需要Xdebug助手扩展,因为Xdebug将尝试与端口9003上的调试器连接,并将每个web请求都连接到PHP。)
最后,我注释掉了xdebug.log=/tmp/xdebug/xdebug.log设置,因为这会产生非常大的详细日志。(但它在最初诊断正在发生的事情时很有用。)
更新
要在VSCode的“启动当前打开的脚本”调试配置中使用xdebug.start_with_request=trigger和xdebug.trigger_value=VSCODE,我必须在launch.json中的"env"部分中设置正确的环境变量
        {
            "name": "Launch currently open script",
            "type": "php",
            "request": "launch",
            "program": "${file}",
            "cwd": "${fileDirname}",
            "port": 9003,
            "pathMappings": {
                "/srv/www/myphpwebsite": "${workspaceRoot}"
            },
            //"stopOnEntry": true,
            //"log": true,
            "env": {
                "XDEBUG_MODE": "debug",
                "XDEBUG_TRIGGER": "VSCODE"
            }
        },
祝你的X调试好运!
https://stackoverflow.com/questions/66190658
复制相似问题
腾讯云开发者
