
Matplotlib加速将绘图保存到磁盘
我想要创建一个动画从大约250个单独的框架,显示数据绘制为二维图像在一个数字与4x11子面板。这些数据将速度的功率谱表示为时间频率和纬度的函数。但是,每个帧大约需要4秒来创建和保存,包括数据的运行时计算。在非交互式绘图模式下,我使用'agg‘作为后端,以避免用于交互式绘图功能的时间。
这里的速度瓶颈不是计算要绘制的数据,而是将绘图保存到磁盘。例如,随机数据的运行时间(见下面的代码)和只有5帧没有保存的情节是一样的东西。就像5秒,节省情节17-19秒。对于我使用的实际数据,需要绘制更多的情节艺术家(面板上的文本、附加的行图等),但脚本执行时间非常相似。用于大约250个帧,这意味着大约900秒,因此15分钟来计算数据,然后保存图表。但是,由于我可能希望生成几次类似的帧,或者数据略有不同,所以最好减少这个脚本的执行时间。
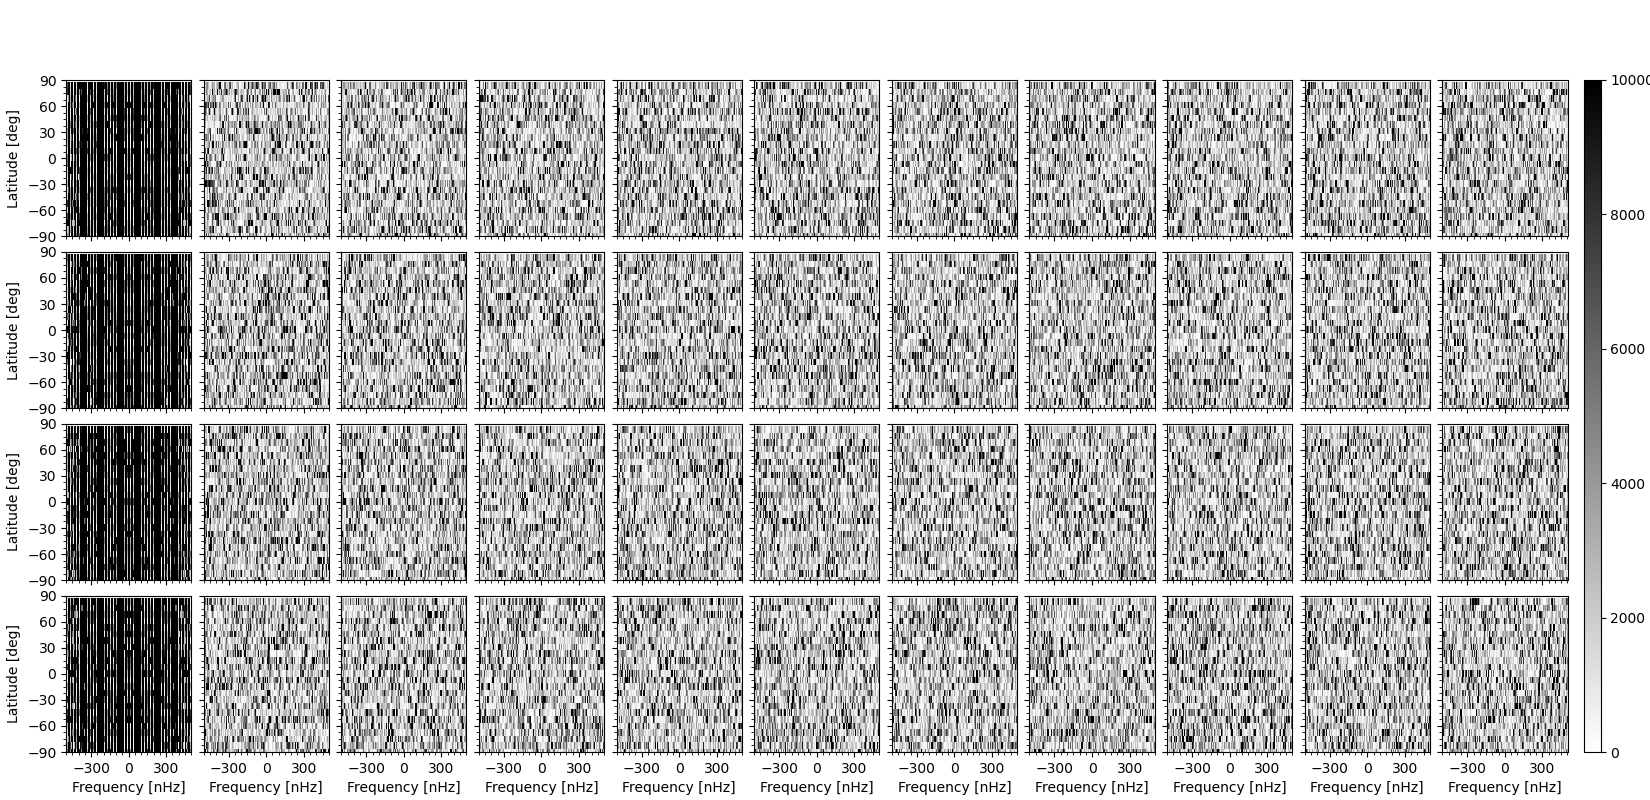
下面给出了一个(希望)可重复的代码,它使用随机数据,但数据大小与我使用的实际数据相等。下面还可以找到一个示例帧(由代码生成的第一个框架)。在代码中,函数create_fig()生成一个包含虚拟数据的子面板的图形,在不同帧上的for-loop中,只替换子面板中的数据。
有一种方法可以加速将地块保存到png文件中吗?,任何帮助都非常感谢!
# import packages
import numpy as np
import time

import matplotlib as mpl
import matplotlib.pyplot as plt

path_plots_out = '/home/proxauf'

# set up grids
nt, nlat, nlon = 3328, 24, 48
dlat = 7.5
lats = np.linspace(-90,90-dlat,nlat)

dt = 98191.08

nu = (-1) * np.fft.fftfreq(nt, dt) * 10 ** 9
nnu = len(nu)

nu_fftshift = np.fft.fftshift(nu)
dnu_fftshift = nu_fftshift[1] - nu_fftshift[0]

nu_lims = [-500, 500]
ind_nu_xlims = np.where(np.logical_and(nu_fftshift >= nu_lims[0], nu_fftshift <= nu_lims[1]))[0]
ext_box_nu_lat = [nu_fftshift[ind_nu_xlims][0] - dnu_fftshift / 2, nu_fftshift[ind_nu_xlims][-1] + dnu_fftshift / 2, lats[0] - dlat / 2.0, lats[-1] + dlat / 2.0]
nnu_cut = len(ind_nu_xlims)

plt.ioff()
if plt.rcParams['interactive']:
    mpl.use('Qt5Agg')
else:
    mpl.use('agg')

# plotting function
def create_fig():

    data_xlabels = np.zeros((nrows, ncols), dtype='U30')
    data_xlabels[-1, :] = r'Frequency [nHz]'
    data_xticks = np.array([[np.linspace(-300, 300, 3)] * ncols] * nrows)
    data_xticks_minor = np.array([[np.linspace(-500, 500, 21)] * ncols] * nrows)
    data_xlims = np.array([[(-500, 500)] * ncols] * nrows)
    data_ylabels = np.zeros((nrows, ncols), dtype='U30')
    data_ylabels[:, 0] = r'Latitude [deg]'
    data_yticks = np.array([[np.linspace(-90, 90, 7)] * ncols] * nrows)
    data_yticks_minor = np.array([[np.linspace(-90, 90, 25)] * ncols] * nrows)
    data_ylims = np.array([[(-90, 90)] * ncols] * nrows)

    plot_xticks = np.zeros((nrows, ncols), dtype=bool)
    plot_xticks[-1, :] = True
    plot_yticks = np.zeros((nrows, ncols), dtype=bool)
    plot_yticks[:, 0] = True

    fig_left, fig_right, fig_bottom, fig_top, fig_hspace, fig_wspace = (0.04, 0.95, 0.06, 0.90, 0.1, 0.1)
    fig, axes = plt.subplots(nrows, ncols, figsize=figsize)
    data_list = []

    for i in range(nrows):
        data_list_temp = []
        for j in range(ncols):
            ax = axes[i, j]
            im = ax.imshow(np.zeros((nnu_cut, nlat)).T, interpolation='nearest', origin='lower', aspect='auto', cmap='binary', extent=ext_box_nu_lat)
            im.set_clim(0,1e4)
            ax.set_xlabel(data_xlabels[i, j])
            ax.set_ylabel(data_ylabels[i, j])
            ax.set_xlim(data_xlims[i, j])
            ax.set_ylim(data_ylims[i, j])
            ax.set_xticks(data_xticks[i, j])
            ax.set_xticks(data_xticks_minor[i, j], minor=True)
            ax.set_yticks(data_yticks[i, j])
            ax.set_yticks(data_yticks_minor[i, j], minor=True)
            if not plot_xticks[i, j]:
                ax.tick_params(labelbottom=False)
            if not plot_yticks[i, j]:
                ax.tick_params(labelleft=False)
            data_list_temp.append(im)
        data_list.append(data_list_temp)

    fig.subplots_adjust(left=fig_left, right=fig_right, bottom=fig_bottom, top=fig_top, hspace=fig_hspace, wspace=fig_wspace)
    fig.canvas.draw()
    ax1 = axes[0, -1]
    ax2 = axes[-1, -1]
    top = ax1.get_position().y1
    bottom = ax2.get_position().y0
    right = ax2.get_position().x1
    cbar_pad = 0.01
    cbar_width = 0.01
    cbar_height = top - bottom
    cax = fig.add_axes([right + cbar_pad, bottom, cbar_width, cbar_height])
    cbar = plt.colorbar(data_list[-1][-1], ax=axes[-1, -1], cax=cax)

    return fig, axes, data_list

nrows = 4
ncols = 11
figsize = (16.5, 8)

# create figure with empty subpanels
fig, axes, data_list = create_fig()

# generate some data
np.random.seed(100)
data1 = np.random.rand(nt,nlat,nlon)
data2 = np.random.rand(nt,nlat,nlon)
data3 = np.random.rand(nt,nlat,nlon)
data4 = np.random.rand(nt,nlat,nlon)

wsize = nt // 4
data1_temp = np.zeros((nt, nlat, nlon))
data2_temp = np.zeros((nt, nlat, nlon))
data3_temp = np.zeros((nt, nlat, nlon))
data4_temp = np.zeros((nt, nlat, nlon))
data1_temp[:wsize,:,:] = data1[:wsize,:,:]
data2_temp[:wsize,:,:] = data2[:wsize,:,:]
data3_temp[:wsize,:,:] = data3[:wsize,:,:]
data4_temp[:wsize,:,:] = data4[:wsize,:,:]

frame_cad = 10
# do not activate, else program will take about 15-20 minutes to finish
# frame_inds = range(0, nt - wsize + 1, frame_cad)
frame_inds = range(0, 50, frame_cad)
t0 = time.time()
for c, i in enumerate(frame_inds):
    print(c)
    if i >= 1:
        # fill in data for the next frame
        data1_temp[i-frame_cad:i] = 0.0
        data1_temp[i+wsize- 1:i+wsize-1+frame_cad] = data1[i+wsize-1:i+wsize-1+frame_cad,:,:]
        data2_temp[i-frame_cad:i] = 0.0
        data2_temp[i+wsize- 1:i+wsize-1+frame_cad] = data2[i+wsize-1:i+wsize-1+frame_cad,:,:]
        data3_temp[i-frame_cad:i] = 0.0
        data3_temp[i+wsize- 1:i+wsize-1+frame_cad] = data3[i+wsize-1:i+wsize-1+frame_cad,:,:]
        data4_temp[i-frame_cad:i] = 0.0
        data4_temp[i+wsize- 1:i+wsize-1+frame_cad] = data4[i+wsize-1:i+wsize-1+frame_cad,:,:]
    # compute power spectrum
    pu1_temp = np.abs(np.fft.fftn(data1_temp, axes=(0, 2))) ** 2
    pu2_temp = np.abs(np.fft.fftn(data2_temp, axes=(0, 2))) ** 2
    pu3_temp = np.abs(np.fft.fftn(data3_temp, axes=(0, 2))) ** 2
    pu4_temp = np.abs(np.fft.fftn(data4_temp, axes=(0, 2))) ** 2
    pu_temp_list = [pu1_temp, pu2_temp, pu3_temp, pu4_temp]
    # update data in subpanels
    for s in range(nrows):
        for j in range(ncols):
            data_list[s][j].set_data(np.fft.fftshift(pu_temp_list[s][:,:,j], axes=(0,))[ind_nu_xlims].T)
    # save figure
    fig.savefig('%s/stackoverflow_test/frame_%04d.png' % (path_plots_out, c))
plt.close()
print(time.time() - t0)
Update:修改后的代码块(没有小的代码块,pyfftw而不是numpy,绝对平方计算速度更快;注意:从create_fig()重命名到plot_data_list的data_list返回参数),5帧的运行时间大约为6s。最大的速度提升来自于小滴答的失活(如Jody Klymak's answer中提到的)。
# use np.take_along_axis() with sorting indices instead of np.fft.fftshift() later, gives a slight (not too much!) speed boost
ind_nu_xlims = np.where(np.logical_and(nu >= nu_lims[0], nu <= nu_lims[1]))[0]
ind_nu_sort = np.argsort(nu[ind_nu_xlims])
nu_sort = np.take_along_axis(nu[ind_nu_xlims],ind_nu_sort,axis=0)
ext_box_nu_lat = [nu_sort[0] + dnu_fftshift / 2, nu_sort[-1] - dnu_fftshift / 2, lats[0] - dlat / 2.0, lats[-1] + dlat / 2.0]

# plotting function
def create_fig():

            # deactivating ticks massively (!) boosts plotting performance
            # ax.set_xticks(data_xticks_minor[i, j], minor=True)
            # ax.set_yticks(data_yticks_minor[i, j], minor=True)

data_list = [data1, data2, data3, data4]

# wisdom makes FFTs much faster using pyfftw than using numpy
# enable cache and set cache memory-keeping time sufficiently large
# this depends on the computation time between FFT calls
pyfftw.interfaces.cache.enable()
pyfftw.interfaces.cache.set_keepalive_time(5)

for c, i in enumerate(frame_inds):
    print(c)
    data_temp_list = [data1_temp, data2_temp, data3_temp, data4_temp]
    pu_temp_list = []
    for j, data_temp in enumerate(data_temp_list):
        if i >= 1:
            # fill in data for the next frame
            data_temp[i-frame_cad:i] = 0.0
            data_temp[i+wsize-1:i+wsize-1+frame_cad] = data_list[j][i+wsize-1:i+wsize-1+frame_cad,:,:]
        # compute Fourier transform via pyfftw; wisdom makes FFTs much faster using pyfftw than using numpy
        pu_temp = pyfftw.interfaces.numpy_fft.fftn(data_temp, axes=(0, 2), threads=-1)
        # compute absolute-square using np.real(x * np.conj(x));
        # about same speed as np.real(x) * np.imag(x);
        # faster than np.einsum('ijk,ijk->ijk',x,np.conj(x));
        # also faster than np.abs(x)**2 since np.abs(x)**2 first takes square-root, then squares again
        pu_temp = np.real(pu_temp*np.conj(pu_temp))
        pu_temp_list.append(pu_temp)
    # update data in subpanels
    for s in range(nrows):
        for j in range(ncols):
            # use np.take_along_axis() with sorting indices instead of np.fft.fftshift(), gives a slight (not too much!) speed boost
            plot_data_list[s][j].set_data(np.take_along_axis(pu_temp_list[s][ind_nu_xlims,:,j], ind_nu_sort[:,None], axis=0).T)
    # save figure
    fig.savefig('%s/stackoverflow_test/frame_%04d.png' % (path_plots_out, c))
plt.close()
print(time.time() - t0)回答 2
Stack Overflow用户
发布于 2021-02-09 18:31:53
所以,如果这正是你想要的情节,那么我认为你做的最快,你可以做到。我5位数得到15秒,不储蓄得到5分.
信不信由你,让它更快的简单方法是放弃你的小滴答。如果我评论这些行,我得到8秒,70%的速度.滴答是非常昂贵的材料库。考虑到你的小滴答很小,我建议作为一个简单的优化。
Stack Overflow用户
发布于 2021-02-09 16:57:09
我会给你一些建议,但不是一个解决办法:
- 您正在做一件非常严格的事情来运行矩阵,但是检查是否可以最大化缓存转移矩阵(当您有非常高和狭窄的情况时)
。
- 听说过稀疏矩阵或矩阵压缩技术吗?
在for循环之外的
- 做您需要做的事情??如果去掉
,您将保存1次比较。
- 你能使用并行计算吗?像蟒蛇的Omp?
https://stackoverflow.com/questions/66123211
复制相似问题
腾讯云开发者
