
尝试将Gaussian+Line与数据相匹配
尝试将Gaussian+Line与数据相匹配
提问于 2020-11-20 20:31:58
总的来说,我对python和编程非常陌生(我大约一个月前就开始了)。我现在正在做一个项目。如果我对行话掌握得不好,我很抱歉。
我得到了一个csv文件,它有一个波长,然后从那个波长观察到30个。我应该运行一些代码,将波长作为自变量,然后以1组观测值作为依赖变量。由此,我必须对数据拟合一个line+Gaussian函数,我可以把高斯的平均值(Mu)作为我需要更多分析的变量。为了得到一个很好的拟合,我必须找到一种方法来自动对高斯+线的参数进行初始猜测。我觉得我可能已经在某种程度上偶然发现了这一点,因为它为每一组观测生成的高斯拟合似乎非常适合。得到直线的梯度和y截距的一个很好的方法是为数据绘制一个线性拟合,并在gaussian+line拟合中使用m和c的值,但我不确定我是否正确地这样做了。
我的问题是,如何从这些数据中提取出高斯平均值的值?现在,我的控制台显示的平均值是0 +/- 0,尽管这肯定不是真的。我将要展示的代码是针对第二组观测的,尽管我希望一旦我为一组观测确定了代码,我就可以简单地复制和粘贴它,用于所有其他观察集,并简单地调整读取的数据。
x=spectral_data[:,0] #selecting column 0 to be x-axis data
y2=spectral_data[:,2] #selecting column 1 to be y-axis data
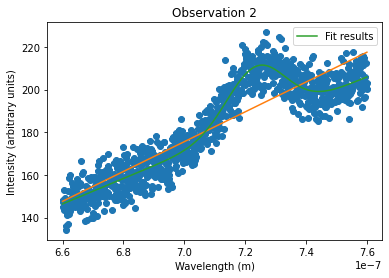
plt.scatter(x,y2) #produce scatter plot
plt.title('Observation 2')
plt.ylabel('Intensity (arbitrary units)')
plt.xlabel('Wavelength (m)')
m,c=np.polyfit(x,y2,deg=1) #fits a linear model to the data, with m = slope and c = intercept
plt.plot(x,y2,'*')
plt.plot(x,c+m*x,'-') #plots the fit
print('The slope and intercept of the regression is,', m,c)
m_best=m
c_best=c
def fit_gauss(x,a,mu,sig,m,c): #defining a function for the gaussian+line fit
gaus = a*sp.exp(-(x-mu)**2/(2*sig**2))
line = m*x+c
return gaus + line
initial_guess=[160,7.1*10**-7,0.2*10**-7,m_best,c_best]
po,po_cov=sp.optimize.curve_fit(fit_gauss,x,y2,initial_guess)
#print("The parameters")
#print(po)
#print('The covariance matrix')
#print(po_cov)
print("The signal parameters are")
print(" Gaussian amplitude = %.1f +/- %.1f" %(po[0],sp.sqrt(po_cov[0,0])))
print(" mu = %.1f +/- %.1f"%(po[1],sp.sqrt(po_cov[1,1])))
print(" Gaussian width (sigma) = %.1f +/- %.1f"%(po[2],sp.sqrt(po_cov[2,2])))
print("and the background estimate is")
print(" m = %.2f +/- %.2f"%(po[3],sp.sqrt(po_cov[3,3])))
print(" c = %.0f +/- %.0f"%(po[4],sp.sqrt(po_cov[4,4])))
plt.plot(x,fit_gauss(x,po[0],po[1],po[2],po[3],po[4]),label='Fit results')
plt.legend()
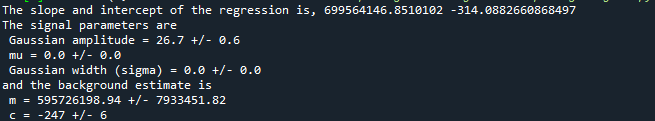
plt.show()控制台响应
The slope and intercept of the regression is, 699564146.8510102 -314.0882660868497
The signal parameters are
 Gaussian amplitude = 26.7 +/- 0.6
 mu = 0.0 +/- 0.0
 Gaussian width (sigma) = 0.0 +/- 0.0
and the background estimate is
 m = 595726198.94 +/- 7933451.82
 c = -247 +/- 6
控制台响应
数据图
回答 1
Stack Overflow用户
回答已采纳
发布于 2020-11-21 02:29:08
在代码底部打印出来之前,您正在做所有的事情。所以你写:
print(" mu = %.1f +/- %.1f"%(po[1],sp.sqrt(po_cov[1,1])))您可以使用%.1f指定您的精度,这意味着您的数字数将限制在点之后的一位数。1294.423变成1294.4,0.001变成0.0!有关更多信息,请查看例如:
查看您的绘图,您可以看到您的数据的大小为1e-7,因此您的字符串的格式正在按预期工作。您可以使用指数格式代替,即%.1e或只是得到您的幅度通过缩放数据事先!
页面原文内容由Stack Overflow提供。腾讯云小微IT领域专用引擎提供翻译支持
原文链接:
https://stackoverflow.com/questions/64936481
复制相关文章
相似问题
腾讯云开发者
