
Networkx在节点旁边显示特征向量中心值
Networkx在节点旁边显示特征向量中心值
提问于 2020-11-06 15:32:10
我有一个圆形布局网络加权图。我想知道,在计算了特征向量中心性值之后,是否有一种方法在图上显示其各自节点旁边的图上的值
centrality = nx.eigenvector_centrality_numpy(G)

print([f"{node} {centrality[node]:0.3f}" for node in centrality])回答 1
Stack Overflow用户
回答已采纳
发布于 2020-11-06 16:08:52
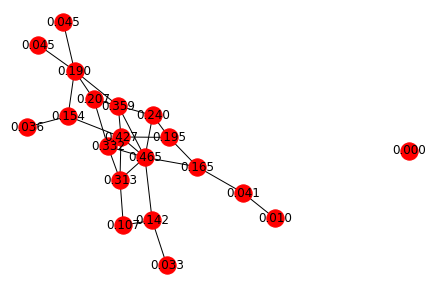
是的,您可以将nx.eigenvector_centrality_numpy的结果设置为nx.draw函数的节点标签,因为nx.eigenvector_centrality_numpy为图中的每个节点返回一个result样的{node: value},这等于nx.draw标签使用的格式:
import networkx as nx

# Create a random graph
G = nx.gnp_random_graph(20, 0.2)

# Calculate centrality
centrality = nx.eigenvector_centrality_numpy(G)

# Create labels dict with fixed digit format
labels = {
    node: '{:.3f}'.format(centrality[node])
    for node in centrality
}

# Draw the graph with labels
nx.draw(
    G,
    with_labels=True,
    labels=labels,
    node_color='#FF0000'
)
页面原文内容由Stack Overflow提供。腾讯云小微IT领域专用引擎提供翻译支持
原文链接:
https://stackoverflow.com/questions/64717454
复制相关文章
相似问题
腾讯云开发者
