
如何在ThinkOrSwim平台上完成thinkscript?
如何在ThinkOrSwim平台上完成thinkscript?
提问于 2020-10-05 20:38:23
我正在ThinkOrSwim平台上玩ThinkOrSwim代码。特别是在MacOSX上运行这个工具。我想知道是否有像附加调试器那样调试ThinkScript并逐行遍历脚本的方法。
回答 2
Stack Overflow用户
回答已采纳
发布于 2021-03-26 18:13:03
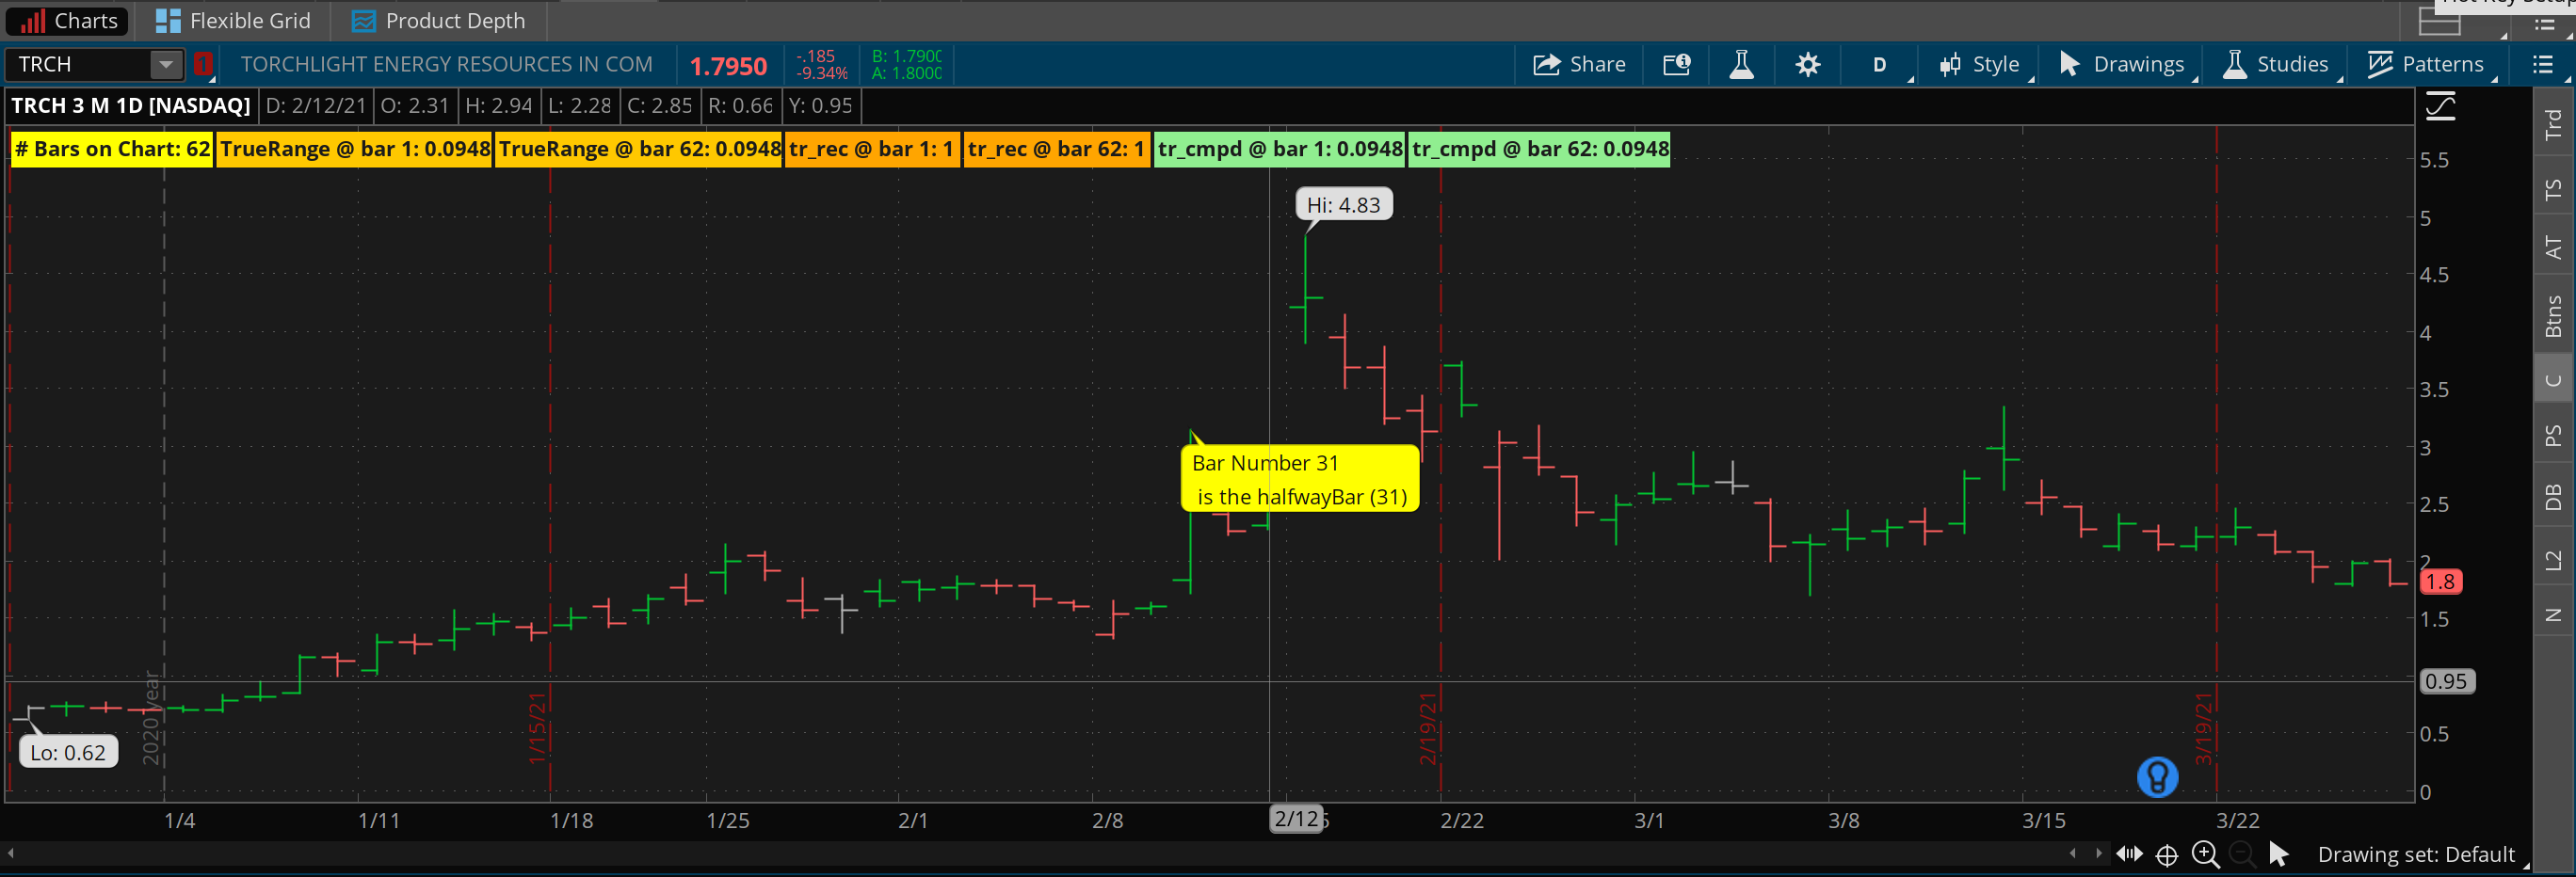
正如@Gary所指出的,thinkScript没有调试器工具。您可以使用图表气泡(如Gary建议的那样)和图表标签。
当满足条件时,图表气泡将出现在指定的栏上。当满足条件时,图表标签出现在图表的左上方。
语法
备注:
- 带有空格的参数标签需要双引号;没有空格的标签不需要引号。
- 当提供了所有所需的参数时,不需要参数标签,而且这些参数是按预期顺序排列的。为了清晰起见,我在这个语法描述中向他们展示了它们。
- 参数不必出现在单个行上。同样,为了清晰起见,我已经在这个语法描述中这样做了,所以我可以注释参数的含义。
AddChartBubble("time condition", # condition defining bar where bubble should appear
               "price location", # which price should bubble point at (eg, high, low)
               text,             # text to display in bubble
               color,            # bubble color
               up                # display bubble above price (yes) or below it (no)
);AddLabel(visible, # condition defining whether the label should appear; yes means always
text, # text to display in label
color # label color
);另外,当您单击选择列表中的问号时,#hint: ....会为代码显示一条“助手”消息。此外,提示文本中的\n在这一点上放置了一个“换行符”。
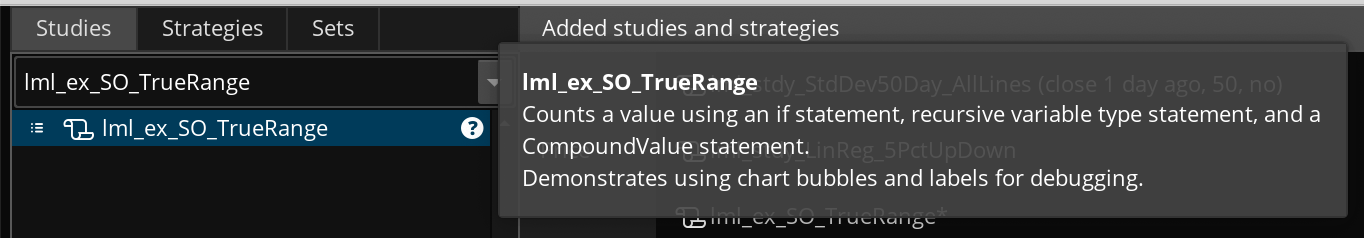
示例代码
#hint: Counts a value using an if statement, recursive variable type statement, and a CompoundValue statement.\nDemonstrates using chart bubbles and labels for debugging.

def TrueRange;
if BarNumber() == 1 {
    TrueRange = ATR(14)[1];
} else {
    TrueRange = TrueRange[1];
}

def tr_rec = if BarNumber() == 1 then tr_rec[1] + 1 else tr_rec[1];

def tr_cmpd = CompoundValue(1, if BarNumber() == 1 then ATR(14)[1] else tr_cmpd[1], Double.NaN);

# plot Data = close; # not req'd if doing only labels and/or bubbles

def numBars = HighestAll(BarNumber());
def halfwayBar = numBars / 2;

# bubble to test a value
AddChartBubble("time condition"=BarNumber() == halfwayBar,
               "price location"=high,
               text="Bar Number " + BarNumber() + "\n is the halfwayBar (" + halfwayBar + ")",
               color=Color.YELLOW,
               up=no);

# labels to test values
AddLabel(yes, "# Bars on Chart: " + numBars, Color.YELLOW);

AddLabel(yes, "TrueRange @ bar 1: " + GetValue(TrueRange, numBars - 1), Color.ORANGE);
AddLabel(yes, "TrueRange @ bar " + numBars + ": " + TrueRange, Color.ORANGE);

AddLabel(yes, "tr_rec @ bar 1: " + GetValue(tr_rec, numBars - 1), Color.LIGHT_ORANGE);
AddLabel(yes, "tr_rec @ bar " + numBars + ": " + tr_rec, Color.LIGHT_ORANGE);

AddLabel(yes, "tr_cmpd @ bar 1: " + GetValue(tr_cmpd, numBars - 1), Color.LIGHT_GREEN);
AddLabel(yes, "tr_cmpd @ bar " + numBars + ": " + tr_cmpd, Color.LIGHT_GREEN);
Stack Overflow用户
发布于 2020-12-13 02:21:55
没有内置调试器.但是,在编写自定义研究时,可以使用addchart泡()函数在每个栏上显示变量的值。
页面原文内容由Stack Overflow提供。腾讯云小微IT领域专用引擎提供翻译支持
原文链接:
https://stackoverflow.com/questions/64215873
复制相关文章
相似问题
腾讯云开发者
