
R中不同图形的自动绘制
R中不同图形的自动绘制
提问于 2020-10-04 23:03:15
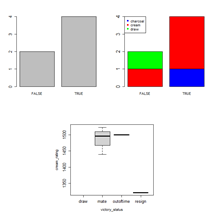
我想用par()做循环遍历数据的函数,在每个图旁边绘制不同的地形图,其中一个是条形图,第二个是散点图,最后一个是框图,我的数据框架:
structure(list(rated = c(FALSE, TRUE, TRUE, TRUE), turns = c(13L,
16L, 61L, 61L), victory_status = structure(c(2L, 3L, 1L, 1L), .Label = c("mate",
"outoftime", "resign"), class = "factor"), winner = structure(c(2L,
1L, 2L, 2L), .Label = c("charcoal", "cream"), class = "factor"),
    increment_code = structure(c(1L, 3L, 3L, 2L), .Label = c("15+2",
    "20+0", "5+10"), class = "factor"), cream_rating = c(1500L,
    1322L, 1496L, 1439L), charcoal_rating = c(1191L, 1261L, 1500L,
    1454L), opening_name = structure(c(4L, 2L, 1L, 3L), .Label = c("King's Pawn Game: Leonardis Variation",
    "Nimzowitsch Defense: Kennedy Variation", "Queen's Pawn Game: Zukertort Variation",
    "Slav Defense: Exchange Variation"), class = "factor")), row.names = c(NA,
4L), class = "data.frame")
我试过:
par(mai=rep(0.5, 4))
layout(matrix(c(1,1, 2,2, 0, 3,3, 0), ncol = 4, byrow = TRUE))
chess_games<-read.csv("./data/games.csv")
chess_games_rated<-table(chess_games$rated)
head (chess_games_rated)
barplot(chess_games_rated, cex.lab=1.5, cex.axis=1.2, font=1)


chess_games<-read.csv("./data/games.csv")
chess_games_rated<-table(chess_games$winner, chess_games$rated)
barplot(chess_games_rated, col=c("blue","red","green"), cex.axis=1.5)
legend(x="topleft", legend = levels(chess_games$winner), col=c("blue","red","green"), pch=19, cex=1, pt.cex = 1)

boxplot.1<-boxplot(cream_rating ~ victory_status, chess_games[!chess_games$winner %in% "draw", ], cex.axis=1.2)
我能把上面的代码分配到函数中吗?
回答 1
Stack Overflow用户
回答已采纳
发布于 2020-10-05 05:25:25
下面是将三个手动绘图的直译成一个函数。
myfunc <- function(data) {
  stopifnot(
    all(c("rated", "winner", "cream_rating", "victory_status") %in% names(data))
  )

  layout(matrix(c(1,1, 2,2, 0, 3,3, 0), ncol = 4, byrow = TRUE))

  rated <- xtabs(~ rated, data = data)
  br1 <- barplot(rated, cex.lab = 1.5, cex.axis = 1.2, font = 1)

  winner_rated <- xtabs(~ winner + rated, data = data)
  br2 <- barplot(winner_rated, col = c("blue","red","green"), cex.axis = 1.5)
  legend(x = "topleft", legend = levels(data$winner),
         col = c("blue","red","green"), pch = 19, cex = 1, pt.cex = 1)

  bx3 <- boxplot(cream_rating ~ victory_status, data = data[!data$winner %in% "draw", ],
                 cex.axis = 1.2)
  invisible(list(br1, br2, bx3))
}

myfunc(chess_games)
它不检查data$winner是否为factor,也不检查唯一levels的数量是否大于长度3。
它以不明显的方式返回一个list,其返回值为三个图幅中的每一个。虽然对于barplot来说这似乎不太鼓舞人心,但如果您想要/需要其他地方的话,它仍然具有一定的信息性。如果需要的话,boxplot包含更多的信息。
ret <- myfunc(chess_games)
str(ret)
# List of 3
#  $ : num [1:2, 1] 0.7 1.9
#  $ : num [1:2] 0.7 1.9
#  $ :List of 6
#   ..$ stats: 'integer' num [1:5, 1:4] NA NA NA NA NA ...
#   ..$ n    : num [1:4] 0 3 1 1
#   ..$ conf : num [1:2, 1:4] NA NA 1458 1534 1500 ...
#   ..$ out  : num(0)
#   ..$ group: num(0)
# ..$ names: chr [1:4] "draw" "mate" "outoftime" "resign"这并不普遍,因为它不能处理自定义或略有不同的数据。这样做很困难,因为您对每个绘图都使用了不同的自定义。因此,我从stopifnot开始,如果找不到所有所需的列,它就会抱怨(并失败)。
如果您需要更多的动态性(运行table (或xtabs)所需的图的变量数或不同的变量),那么这当然是可行的,但是您需要丢失每个图的自定义。
数据。我删除了最后一篇专栏,因为您没有使用它,而且它也没有使用这个简单的read.table进行解析。
chess_games <- read.table(header = TRUE, stringsAsFactors = TRUE, text="
   rated   turns   victory_status  winner  increment_code  cream_rating    charcoal_rating
   FALSE   13     outoftime       cream    15+2             1500           1191
   TRUE    16      resign        charcoal  5+10             1322           1261
   TRUE    61      mate           cream    5+10             1496           1500
   TRUE    61      mate           cream    20+0            1439            1454
   TRUE    95      mate           cream    30+3            1523            1469
FALSE 5 draw draw 10+0 1250 1002 ")页面原文内容由Stack Overflow提供。腾讯云小微IT领域专用引擎提供翻译支持
原文链接:
https://stackoverflow.com/questions/64200683
复制相关文章
相似问题
腾讯云开发者
