
Python子图中的范围,类似于MATLAB的堆栈图()
Python子图中的范围,类似于MATLAB的堆栈图()
提问于 2020-08-11 12:46:48
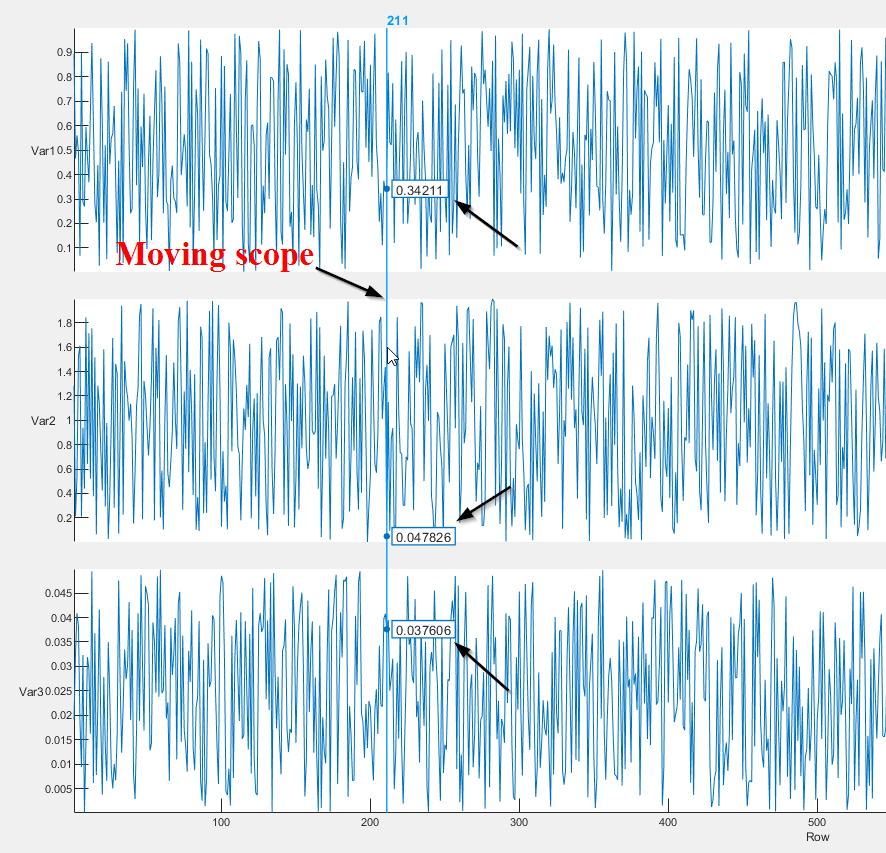
在Python中有一个与MATLAB的stackedplot()相同的绘图函数吗?stackedplot()中的stackedplot()可以用相同的X轴绘制多个变量并垂直叠加。此外,在这个图中有一个范围,它通过移动光标来显示给定X的所有变量的值(请参阅附图)。但是,我已经能够在Python中生成堆叠子图,没有任何问题,但是无法添加这样的作用域,通过移动游标来显示所有变量的值。这个特性在Python中可用吗?
这是一个用MATLAB的stackedplot()绘制的图
import pandas as pd
import numpy as np
from datetime import datetime, date, time
import matplotlib.pyplot as plt
import matplotlib
import matplotlib.transforms as transforms
import mplcursors
from collections import Counter
import collections

def flatten(x):
    result = []
    for el in x:
        if isinstance(x, collections.Iterable) and not isinstance(el, str):
            result.extend(flatten(el))
        else:
            result.append(el)
    return result

def shared_scope(sel):
    sel.annotation.set_visible(False)  # hide the default annotation created by mplcursors
    x = sel.target[0]
    for ax in axes:
        for plot in plotStore:
            da = plot.get_ydata()
            if type(da[0]) is np.datetime64: #pd.Timestamp
                yData = matplotlib.dates.date2num(da) # to numerical values
                vals = np.interp(x, plot.get_xdata(), yData)
                dates = matplotlib.dates.num2date(vals) # to matplotlib dates
                y = datetime.strftime(dates,'%Y-%m-%d %H:%M:%S') # to strings
                annot = ax.annotate(f'{y:.30s}', (x, vals), xytext=(15, 10), textcoords='offset points',
                            bbox=dict(facecolor='tomato', edgecolor='black', boxstyle='round', alpha=0.5))
                sel.extras.append(annot)
            else:
                y = np.interp(x, plot.get_xdata(), plot.get_ydata())
                annot = ax.annotate(f'{y:.2f}', (x, y), xytext=(15, 10), textcoords='offset points', arrowprops=dict(arrowstyle="->",connectionstyle="angle,angleA=0,angleB=90,rad=10"),
                            bbox=dict(facecolor='tomato', edgecolor='black', boxstyle='round', alpha=0.5))
                sel.extras.append(annot)
        vline = ax.axvline(x, color='k', ls=':')
        sel.extras.append(vline)
    trans = transforms.blended_transform_factory(axes[0].transData, axes[0].transAxes)
    text1 = axes[0].text(x, 1.01, f'{x:.2f}', ha='center', va='bottom', color='blue', clip_on=False, transform=trans)
    sel.extras.append(text1)


# Data to plot
data = pd.DataFrame(columns = ['timeOfSample','Var1','Var2'])
data.timeOfSample = ['2020-05-10 09:09:02','2020-05-10 09:09:39','2020-05-10 09:40:07','2020-05-10 09:40:45','2020-05-12 09:50:45']
data['timeOfSample'] = pd.to_datetime(data['timeOfSample'])
data.Var1 = [10,50,100,5,25]
data.Var2 = [20,55,70,60,50]
variables = ['timeOfSample',['Var1','Var2']] # variables to plot - Var1 and Var2 to share a plot

nPlot = len(variables)
dataPts = np.arange(0, len(data[variables[0]]), 1) # x values for plots
plotStore = [0]*len(flatten(variables)) # to store all the plots for annotation purposes later

fig, axes = plt.subplots(nPlot,1,sharex=True)

k=0
for i in range(nPlot):
    if np.size(variables[i])==1:
        yData = data[variables[i]]
        line, = axes[i].plot(dataPts,yData,label = variables[i])
        plotStore[k]=line
        k = k+1
    else:
        for j in range(np.size(variables[i])):
            yData = data[variables[i][j]]
            line, = axes[i].plot(dataPts,yData,label = variables[i][j])
            plotStore[k]=line
            k = k+1
    axes[i].set_ylabel(variables[i])


cursor = mplcursors.cursor(plotStore, hover=True)
cursor.connect('add', shared_scope)
plt.xlabel('Samples')
plt.show()回答 1
Stack Overflow用户
回答已采纳
发布于 2020-08-11 13:44:34
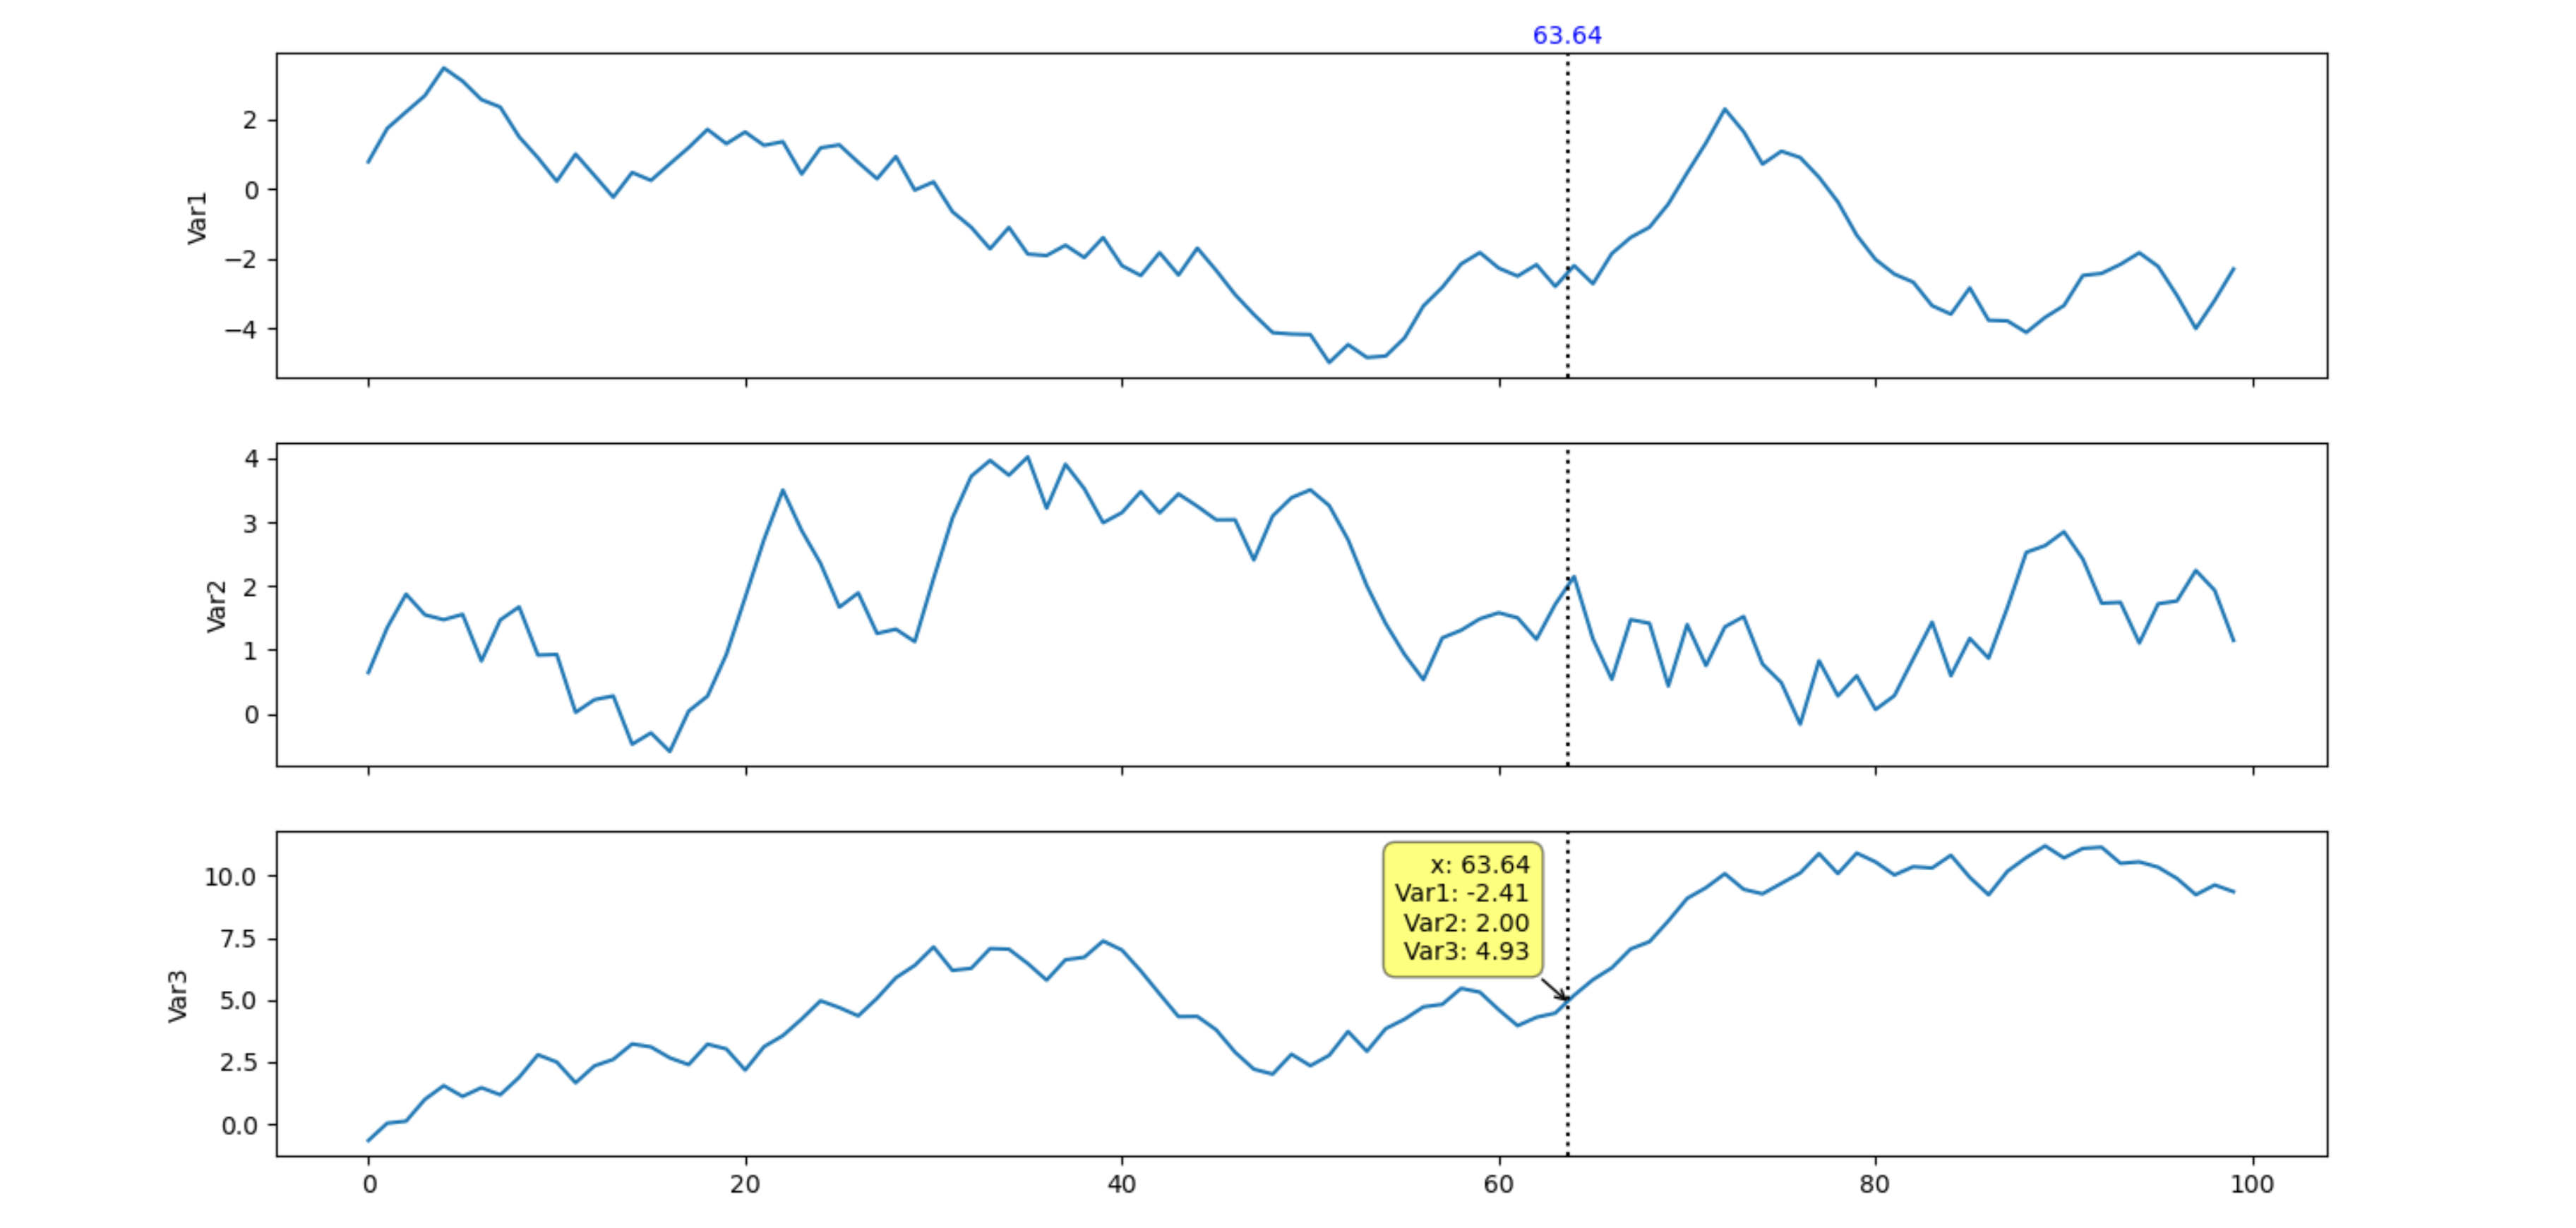
游标可用于在悬停、移动文本和竖直栏时创建注释。sel.extras.append(...)帮助自动隐藏不再需要的元素。
import matplotlib.pyplot as plt
import matplotlib.transforms as transforms
import mplcursors
import numpy as np

def shared_scope(sel):
    x = sel.target[0]
    annotation_text = f'x: {x:.2f}'
    for ax, plot in zip(axes, all_plots):
        y = np.interp(x, plot.get_xdata(), plot.get_ydata())
        annotation_text += f'\n{plot.get_label()}: {y:.2f}'
        vline = ax.axvline(x, color='k', ls=':')
        sel.extras.append(vline)
    sel.annotation.set_text(annotation_text)
    trans = transforms.blended_transform_factory(axes[0].transData, axes[0].transAxes)
    text1 = axes[0].text(x, 1.01, f'{x:.2f}', ha='center', va='bottom', color='blue', clip_on=False, transform=trans)
    sel.extras.append(text1)

fig, axes = plt.subplots(figsize=(15, 10), nrows=3, sharex=True)
y1 = np.random.uniform(-1, 1, 100).cumsum()
y2 = np.random.uniform(-1, 1, 100).cumsum()
y3 = np.random.uniform(-1, 1, 100).cumsum()
all_y = [y1, y2, y3]
all_labels = ['Var1', 'Var2', 'Var3']
all_plots = [ax.plot(y, label=label)[0]
             for ax, y, label in zip(axes, all_y, all_labels)]
for ax, label in zip(axes, all_labels):
    ax.set_ylabel(label)
cursor = mplcursors.cursor(all_plots, hover=True)
cursor.connect('add', shared_scope)

plt.show()
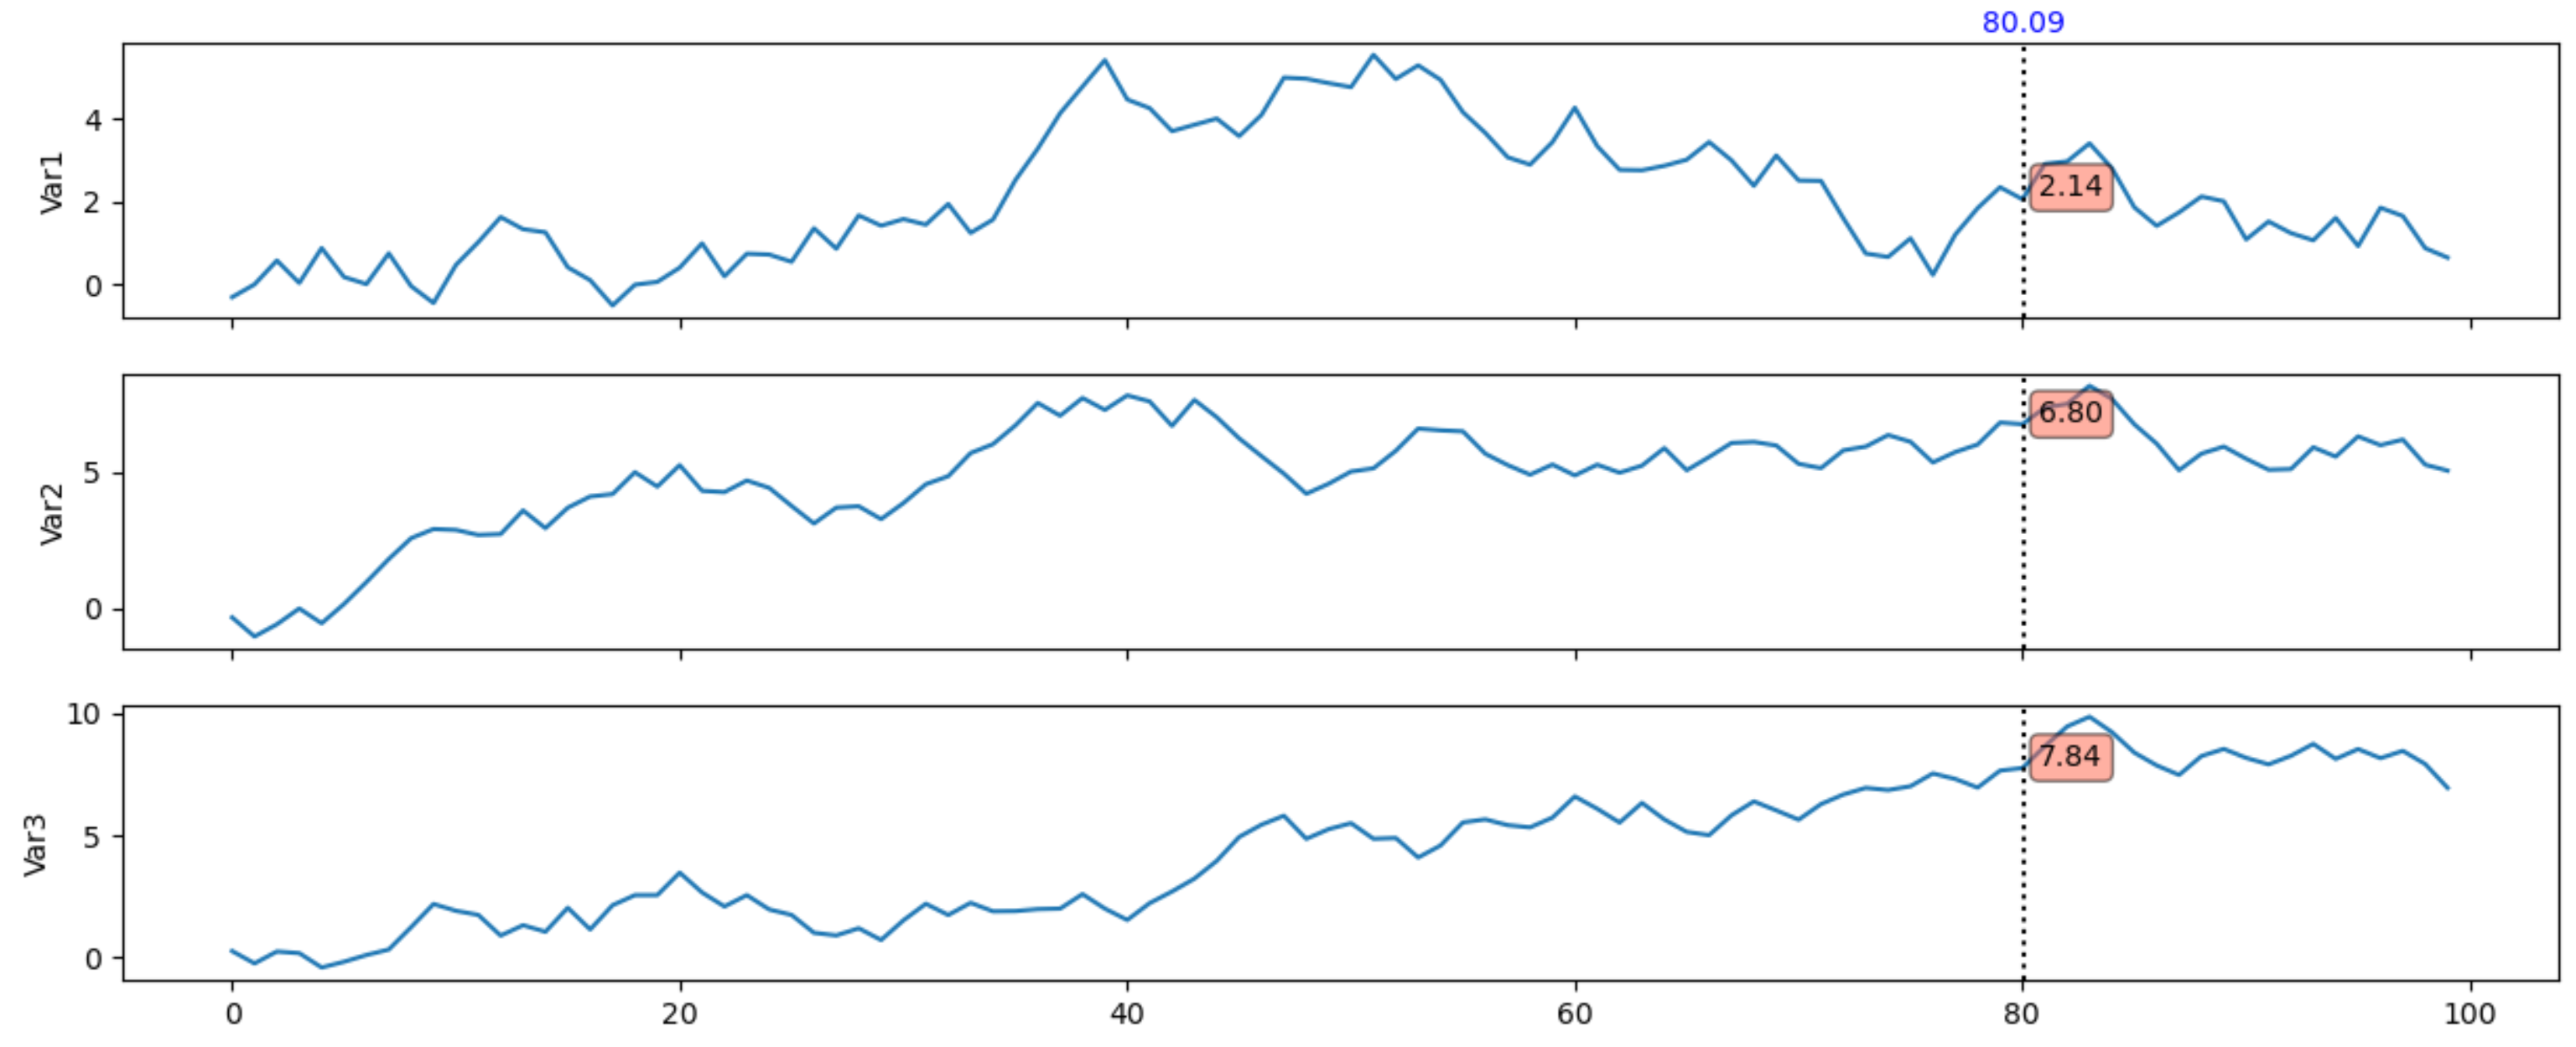
下面是一个版本,每个子图都有单独的注释:
import matplotlib.pyplot as plt
import matplotlib.transforms as transforms
import mplcursors
import numpy as np

def shared_scope(sel):
    sel.annotation.set_visible(False)  # hide the default annotation created by mplcursors
    x = sel.target[0]
    for ax, plot in zip(axes, all_plots):
        y = np.interp(x, plot.get_xdata(), plot.get_ydata())
        vline = ax.axvline(x, color='k', ls=':')
        sel.extras.append(vline)
        annot = ax.annotate(f'{y:.2f}', (x, y), xytext=(5, 0), textcoords='offset points',
                            bbox=dict(facecolor='tomato', edgecolor='black', boxstyle='round', alpha=0.5))
        sel.extras.append(annot)
    trans = transforms.blended_transform_factory(axes[0].transData, axes[0].transAxes)
    text1 = axes[0].text(x, 1.01, f'{x:.2f}', ha='center', va='bottom', color='blue', clip_on=False, transform=trans)
    sel.extras.append(text1)

fig, axes = plt.subplots(figsize=(15, 10), nrows=3, sharex=True)
y1 = np.random.uniform(-1, 1, 100).cumsum()
y2 = np.random.uniform(-1, 1, 100).cumsum()
y3 = np.random.uniform(-1, 1, 100).cumsum()
all_y = [y1, y2, y3]
all_labels = ['Var1', 'Var2', 'Var3']
all_plots = [ax.plot(y, label=label)[0]
             for ax, y, label in zip(axes, all_y, all_labels)]
for ax, label in zip(axes, all_labels):
    ax.set_ylabel(label)
cursor = mplcursors.cursor(all_plots, hover=True)
cursor.connect('add', shared_scope)

plt.show()
页面原文内容由Stack Overflow提供。腾讯云小微IT领域专用引擎提供翻译支持
原文链接:
https://stackoverflow.com/questions/63358465
复制相关文章
相似问题
腾讯云开发者
