
LineCollections的Matplotlib三维绘图中Zorder参数序列的确定
LineCollections的Matplotlib三维绘图中Zorder参数序列的确定
提问于 2020-07-22 00:04:03
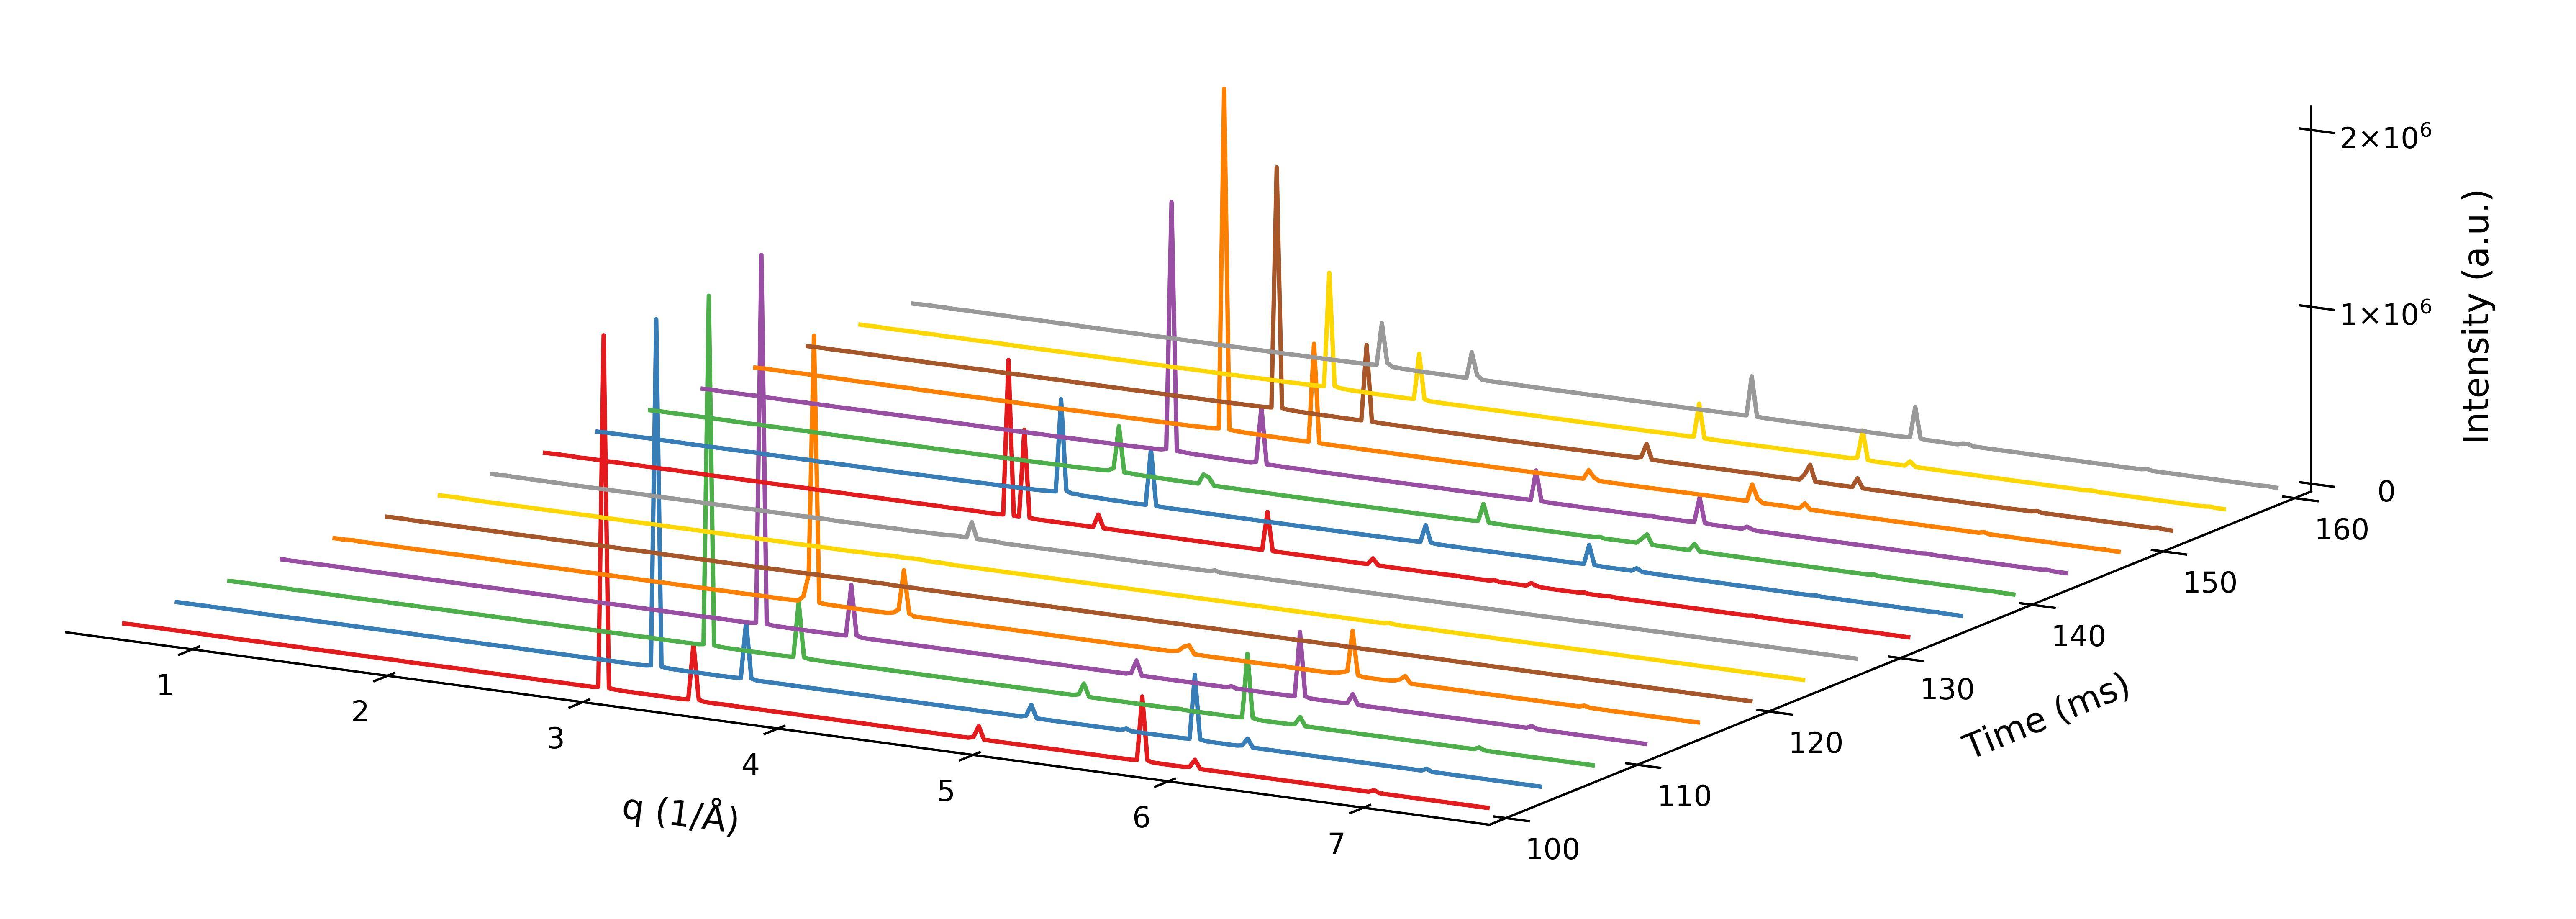
我遇到了问题的三维材料库图显示后续的二维线配置文件随时间。情节的结局正是我希望它看上去的样子,除了2D配置文件以错误的顺序相互重叠外,这让任何看过这个情节的人都感到困惑。配置文件是沿着时间轴正确绘制的,但它们几乎是以相反的顺序添加到绘图中的。我认为这与matplotlib中的"zorder“这个术语有关,但是我在解决这个问题方面没有成功。有人有什么建议吗?
from mpl_toolkits.mplot3d import Axes3D
from matplotlib.lines import Line2D
from matplotlib.collections import LineCollection
import matplotlib.pyplot as plt

profiles = []
times = []

index = 0

for item in intensities:
    integrated_profile = integrate(item)
    profiles.append(list(zip(x_coordinates, integrated_profile)))

    timestamps = int(index+1)
    times.append(timestamps)

    index += 1

profiles = np.array(profiles)
times = np.array(times)


profile_collection = LineCollection(profiles, colors=color_list) #color_list not shown here

fig = plt.figure(dpi=100, figsize=(18,6))
ax = fig.add_subplot(111, projection='3d',proj_type='ortho')
ax.add_collection3d(profile_collection, zs=times, zdir='y')

# I deleted a lot more lines of code which are just formatting the plot
回答 1
Stack Overflow用户
回答已采纳
发布于 2020-07-22 14:51:08
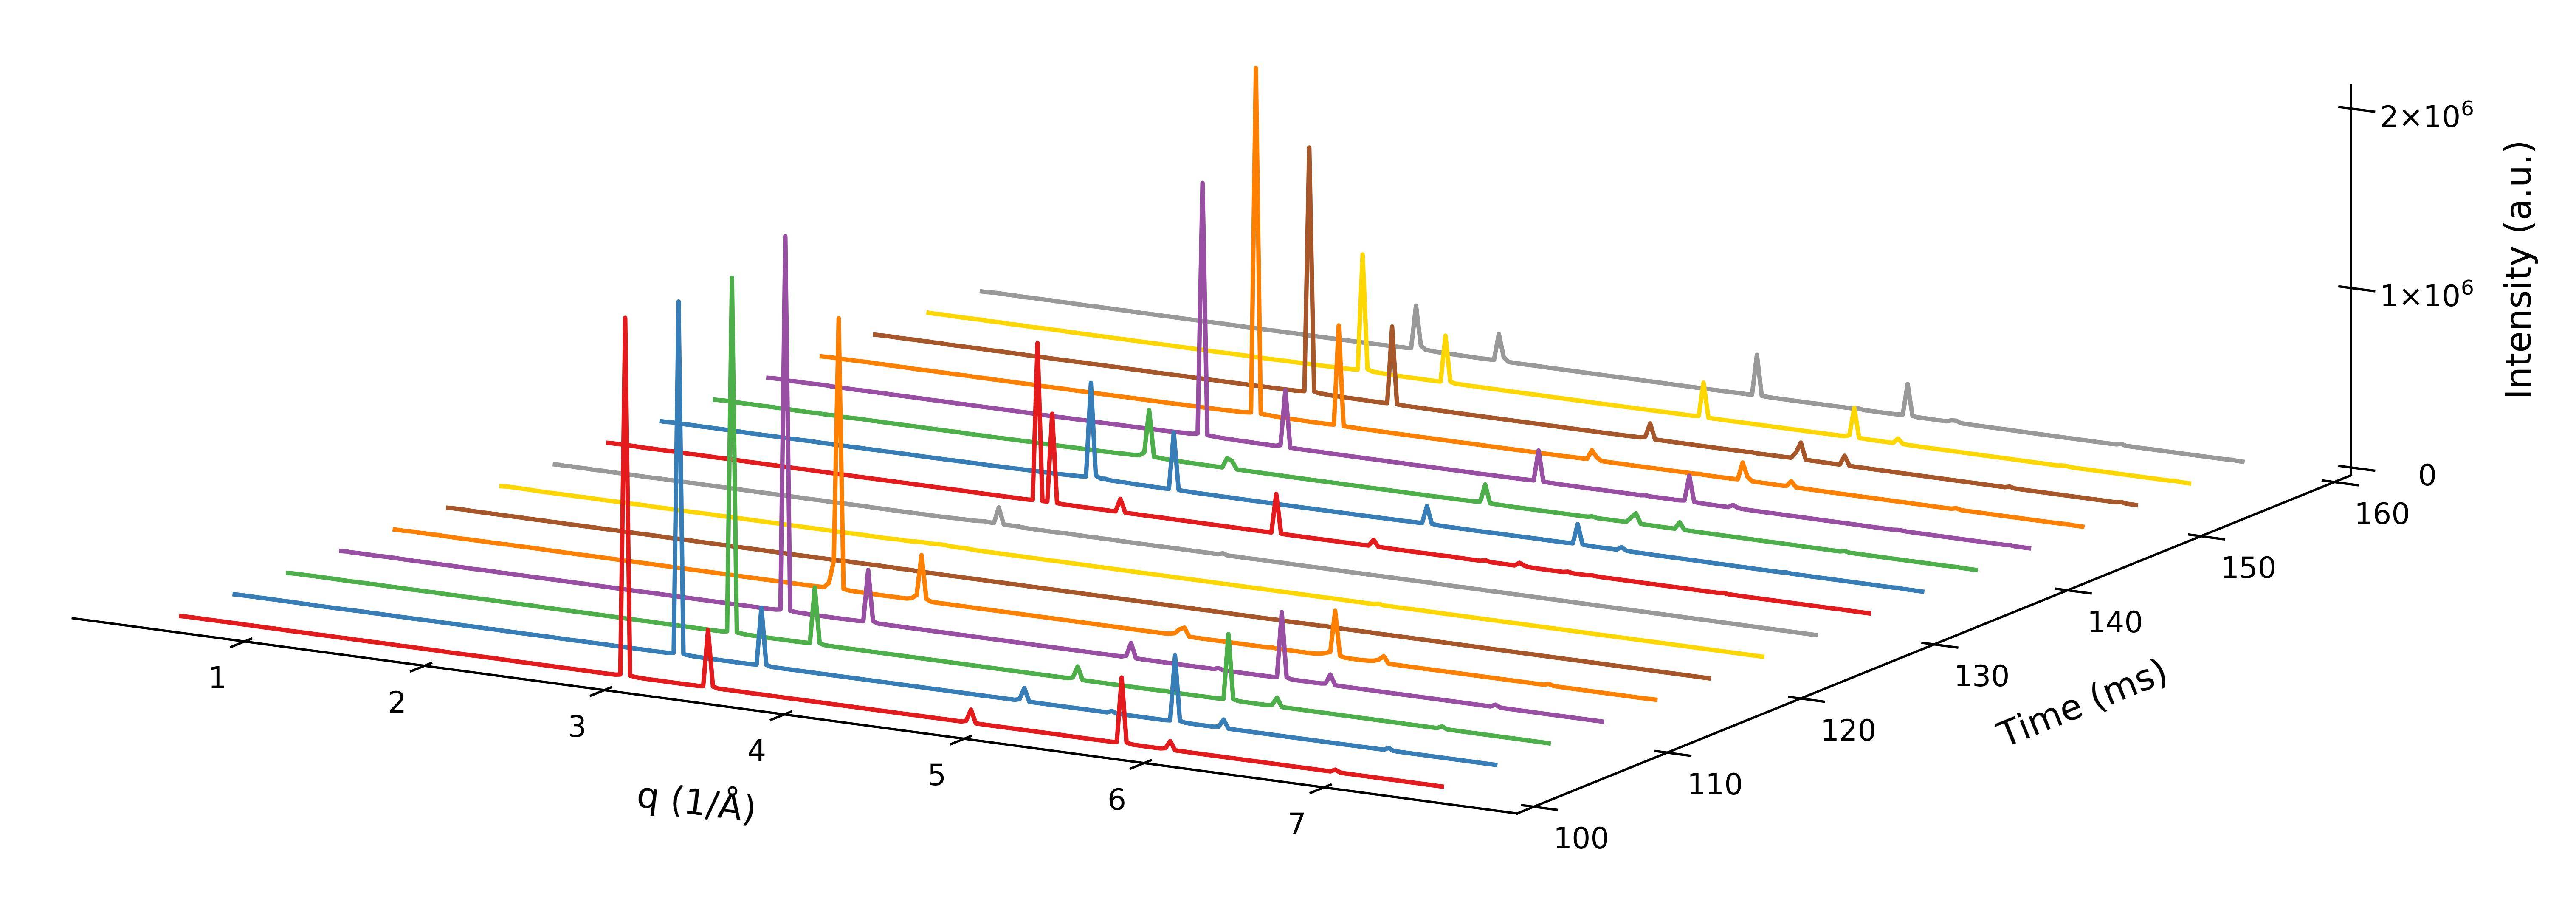
我找到了解决办法。这实际上是创建这种情节的一种更容易的方法。我没有将2D配置文件存储在一个集合中,而是通过循环将它们单独添加到3D图中。集合具有固定的zorder值,因此您不能更改我想要更改的内容。当您循环并分别绘制每个2D配置文件时,您可以根据您想要的方式设置zorder参数。我所做的是:
profiles = []
times = []

index = 0

for item in intensities:
    integrated_profile = integrate(item)
    profiles.append(integrated_profile)

    timestamps = int(index+1)
    times.append(timestamps)

    index += 1

profiles = np.array(profiles)
times = np.array(times)

fig = plt.figure(dpi=100, figsize=(18,6))
ax = fig.add_subplot(111, projection='3d',proj_type='ortho')

index2 = 0
for i in profiles:
    ax.plot(x_coordinates, profiles[index2], zs=times[index2], zdir='y',
            zorder=(len(profiles) - index2), color=next(colors))
    index2 += 1
页面原文内容由Stack Overflow提供。腾讯云小微IT领域专用引擎提供翻译支持
原文链接:
https://stackoverflow.com/questions/63024810
复制相关文章
相似问题
腾讯云开发者
