
用于Chart.JS的xAxis可选背景色
用于Chart.JS的xAxis可选背景色
提问于 2020-07-14 16:39:18
回答 2
Stack Overflow用户
回答已采纳
发布于 2020-07-17 04:43:03
使用图表-插件-注释可以创建备用背景。
请看下面的代码片段,它是从chartjs插件注释的贡献者提供的示例代码中派生出来的。
此代码适用于Chart.js 2.6.0,它仍然会产生一个可能被忽略的脚本错误。不幸的是,我无法使它与最新版本的Chart.js (目前为2.9.3)工作,我现在没有时间进一步调查。
const labels = ["January", "February", "March", "April", "May", "June", "July"];
const annotations = [];
for (let i = 0; i < labels.length; i++) {
  if (i % 2 == 0) {
    annotations.push({
      drawTime: "beforeDatasetsDraw",
      type: "box",
      xScaleID: "x-axis-0",
      yScaleID: "y-axis-0",
      xMin: labels[i],
      xMax: labels[i + 1],
      backgroundColor: "rgba(128, 128, 128, 0.5)",
      borderColor: "rgb(128, 128, 128)",
      borderWidth: 1
    });
  }
};

new Chart('chart', {
  type: "bar",
  data: {
    labels: labels,
    datasets: [{
        label: "Dataset 1",
        backgroundColor: 'red',
        data: [95, 70, 55, -88, -64, 34, -55],
        categoryPercentage: 1,
        barPercentage: 0.8
      },
      {
        label: "Dataset 2",
        backgroundColor: 'green',
        data: [81, 58, 30, -91, -74, 20, -40],
        categoryPercentage: 1,
        barPercentage: 0.9
      }
    ]
  },
  options: {
    responsive: true,
    tooltips: {
      mode: "index",
      intersect: true
    },
    annotation: {
      annotations: annotations
    }
  }
});<script src="https://cdnjs.cloudflare.com/ajax/libs/Chart.js/2.6.0/Chart.min.js"></script>
<script src="https://cdnjs.cloudflare.com/ajax/libs/chartjs-plugin-annotation/0.5.7/chartjs-plugin-annotation.js"></script>
<canvas id="chart" height="90"></canvas>
Stack Overflow用户
发布于 2022-05-11 15:39:51
我们可以使用注释插件来完成这个任务。
import annotationPlugin from "chartjs-plugin-annotation";
import {Chart} from 'chart.js';
Chart.register(annotationPlugin);
此代码将向图表中添加一个框。
{
  type: 'box', #type of draw
  drawTime: 'beforeDraw', #this will decide background or foreground
  yMin: 5, #value min on y axis
  yMax: 10, #value max on y axis
  borderColor: 'rgb(242, 244, 248, 0.9)', #border color of the box
  borderWidth: 1, #boarder width for box
  backgroundColor: '#F2F4F8', #colour of the box
}
从这段代码中
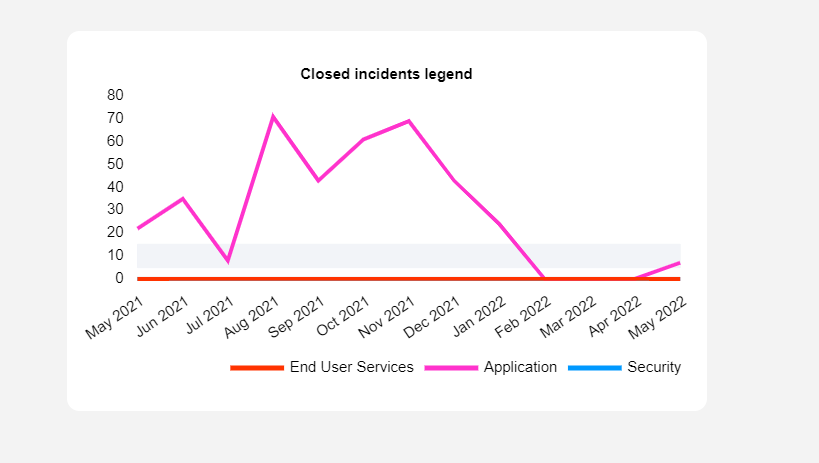
请参阅本文中关于如何执行此操作的文章:https://medium.com/@omi10859/alternative-background-lines-in-chartjs-a626ce4d3bcb
页面原文内容由Stack Overflow提供。腾讯云小微IT领域专用引擎提供翻译支持
原文链接:
https://stackoverflow.com/questions/62899891
复制相关文章
相似问题
腾讯云开发者
