
使用ggplot进行置信区间显示
使用ggplot进行置信区间显示
提问于 2020-05-04 00:44:14
我必须建立一个图的平均值和99%的置信区间(基于t-分布)的数据集布谷鸟软件包。
这是我的解决办法
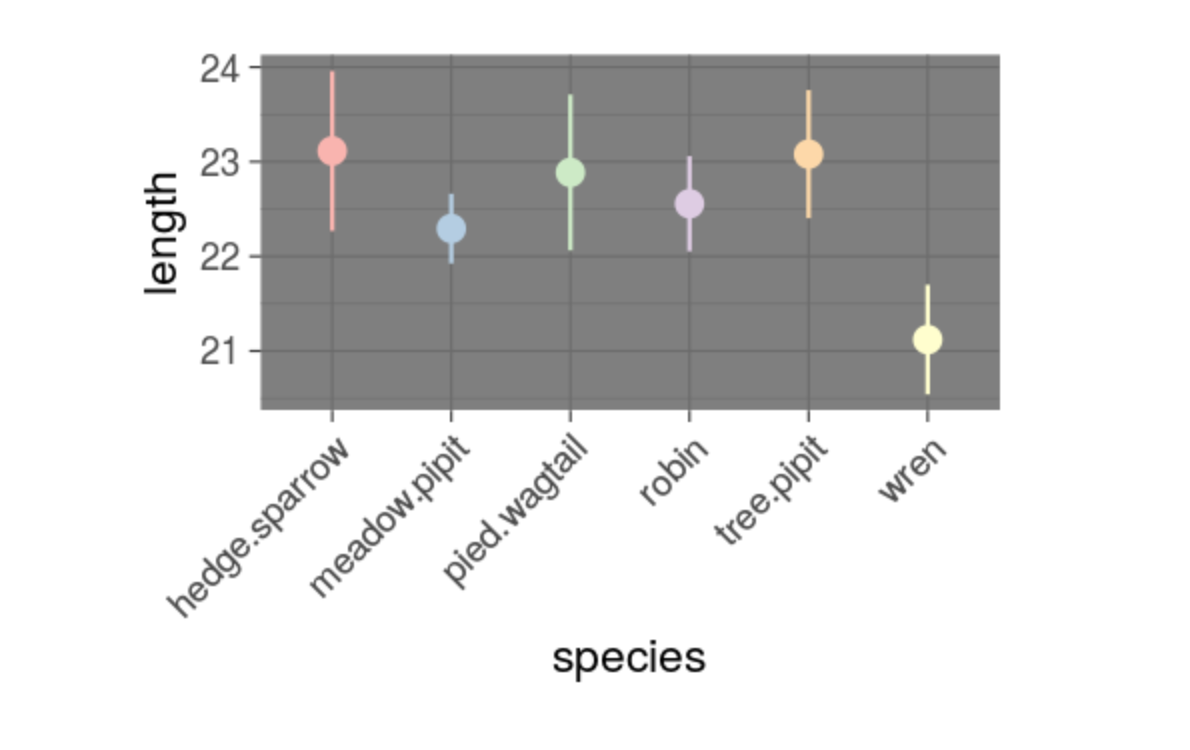
ggplot(data=cuckoos, aes(x=species, y=length, colour=species)) +
    stat_summary(geom='pointrange', fun.args = list(mult=1)) +
    theme_dark() +
    theme(legend.position="none",
          axis.text = element_text(size=10),
          axis.text.x = element_text (angle = 45, hjust = 1)) +
    scale_colour_brewer(palette = "Pastel1") +
    coord_cartesian(ylim=c(21,24))
结果图的置信区间与正确的答案不匹配(见所附图像)。有什么问题吗?
回答 1
Stack Overflow用户
回答已采纳
发布于 2020-05-04 07:22:44
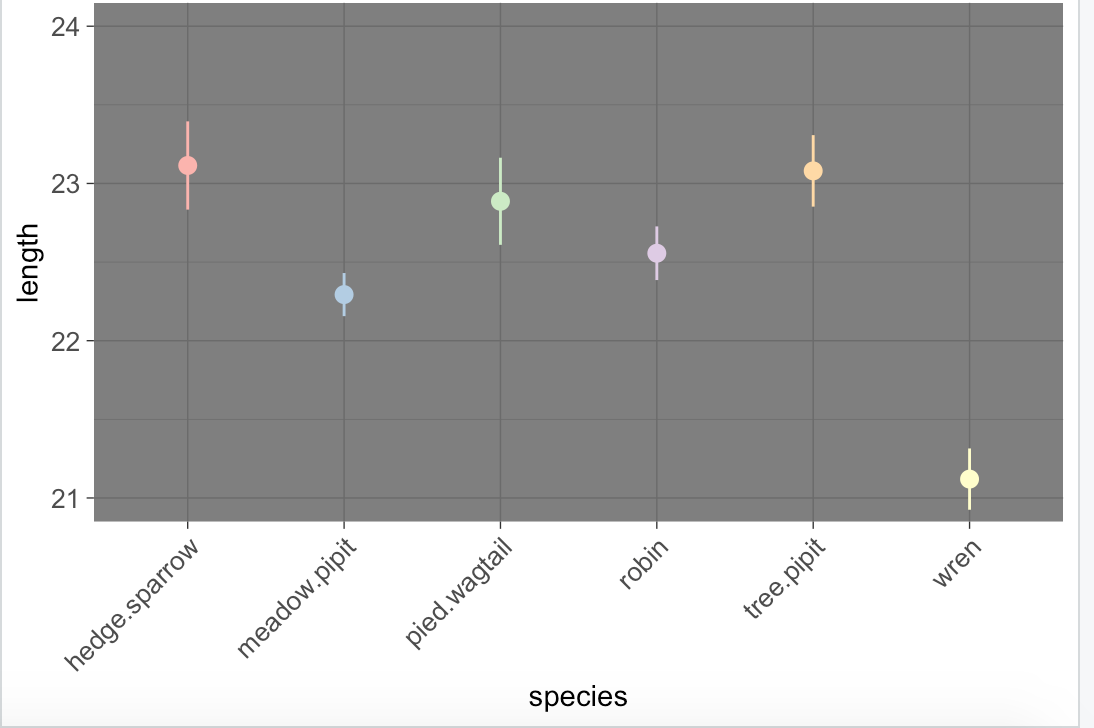
stat_summary函数的默认函数是mean_se,这意味着您实际上得到了平均值和标准差。如果要计算99%的置信区间,则需要使用mean_cl_normal函数并指定要获得0.99置信区间,而不是默认的0.95。
ggplot(data= DAAG::cuckoos, aes(x=species, y=length, colour=species)) +
    stat_summary(geom='pointrange', fun.data = "mean_cl_normal", fun.args = list(conf.int = 0.99)) +
    theme_dark() +
    theme(legend.position="none", axis.text = element_text(size=10), axis.text.x = element_text (angle = 45, hjust = 1)) +
    scale_colour_brewer(palette = "Pastel1") +
coord_cartesian(ylim=c(21,24))页面原文内容由Stack Overflow提供。腾讯云小微IT领域专用引擎提供翻译支持
原文链接:
https://stackoverflow.com/questions/61583518
复制相关文章
相似问题
腾讯云开发者
