
SVG有从屏幕阅读器标题属性出现在视野中的文本解码器。
SVG有从屏幕阅读器标题属性出现在视野中的文本解码器。
提问于 2020-03-13 18:46:38
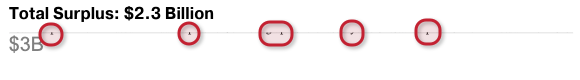
我有几张从Adobe生成的图表SVG,这些SVG已经为web使用和可访问性一致性进行了优化。我注意到文字下降出现在图片的顶部。这些工件根本不应该出现。
Chrome浏览器的屏幕显示
剥离代码
<figure>
  <figcaption>A barchart comparison</figcaption>
  <svg id="bar-chart-current-year" role="group" aria-labelledby="graph-title" aria-describedby="graph-description" xmlns="http://www.w3.org/2000/svg" viewBox="0 0 799.2 598.59">
  <defs>
    <style>
    .cls-1,
    .cls-2,
    .cls-7 {
      fill: none;
    }

    .cls-1,
    .cls-2 {
      stroke: #d8d8d8;
    }

    .cls-1,
    .cls-7 {
      stroke-linejoin: round;
    }

    .cls-2 {
      stroke-miterlimit: 10;
    }

    .cls-3,
    .cls-8 {
      opacity: 0.5;
    }

    .cls-3,
    .cls-6,
    .cls-9 {
      font-size: 1.75rem; /* 28px */
      font-family: ArialMT, Arial;
    }


    .cls-4 {
      fill: #00654e;
    }

    .cls-5 {
      fill: #94d500;
    }

    .cls-7 {
      stroke: #37474f;
      stroke-width: 2px;
    }

    .cls-10 {
      opacity: 0.7;
    }

    </style>
  </defs>
  <title id="graph-title">Bar Chart Comparison</title>
  <desc id="graph-description">A bar graph of the last 5 years ...</desc>
  <text id="screenreader-title">Bar Chart Comparison - A bar graph of the last 5 years ...</text>
  <g id="bar-chart" data-name="bar-chart">
    <path id="gridlines" class="cls-1" d="M1.81,1H799.67M1.81,165.46H799.67M1.81,329.91H799.67" transform="translate(-0.47 -0.5)" />
    <g id="annotation">
      ...
    </g>
    <g id="bar-graphics">
      ...
    </g>
    <g id="bar-graphic-labels" class="cls-10">
    ...
    </g>
    <line id="baseline" class="cls-7" x1="0.53" y1="491.64" x2="798.06" y2="491.64" />
    <g id="y-axis" class="cls-8">
    ...
    </g>
    <g id="x-axis" class="cls-10">
    ...
    </g>
  </g>
  </svg>
</figure>
我怀疑代码中有标题、描述和屏幕阅读器的标题标签。
回答 1
Stack Overflow用户
发布于 2020-03-13 18:46:38
font-size: 0;的实现将隐藏文本,同时将其留给屏幕阅读器使用,解决了以下问题:
页面原文内容由Stack Overflow提供。腾讯云小微IT领域专用引擎提供翻译支持
原文链接:
https://stackoverflow.com/questions/60675769
复制相关文章
相似问题
腾讯云开发者
