
Xamarin.Forms MicroCharts如何向标签中添加多个值
Xamarin.Forms MicroCharts如何向标签中添加多个值
提问于 2020-02-27 10:51:45
我使用从API中读取的数据来跟踪来自GitHub的关于微图表的起始代码:
    List<Entry> entries = new List<Entry>
        {
            new Entry(200)
            {
                Color=SKColor.Parse("#FF1943"),
                Label ="January",
                ValueLabel = "200"
            },
            new Entry(400)
            {
                Color = SKColor.Parse("00BFFF"),
                Label = "March",
                ValueLabel = "400"
            },
            new Entry(-100)
            {
                Color =  SKColor.Parse("#00CED1"),
                Label = "Octobar",
                ValueLabel = "-100"
            },
            };
在ValueLabel中可以添加2-3个值吗?我试着模拟条形图的多个系列
回答 1
Stack Overflow用户
回答已采纳
发布于 2020-02-28 02:41:49
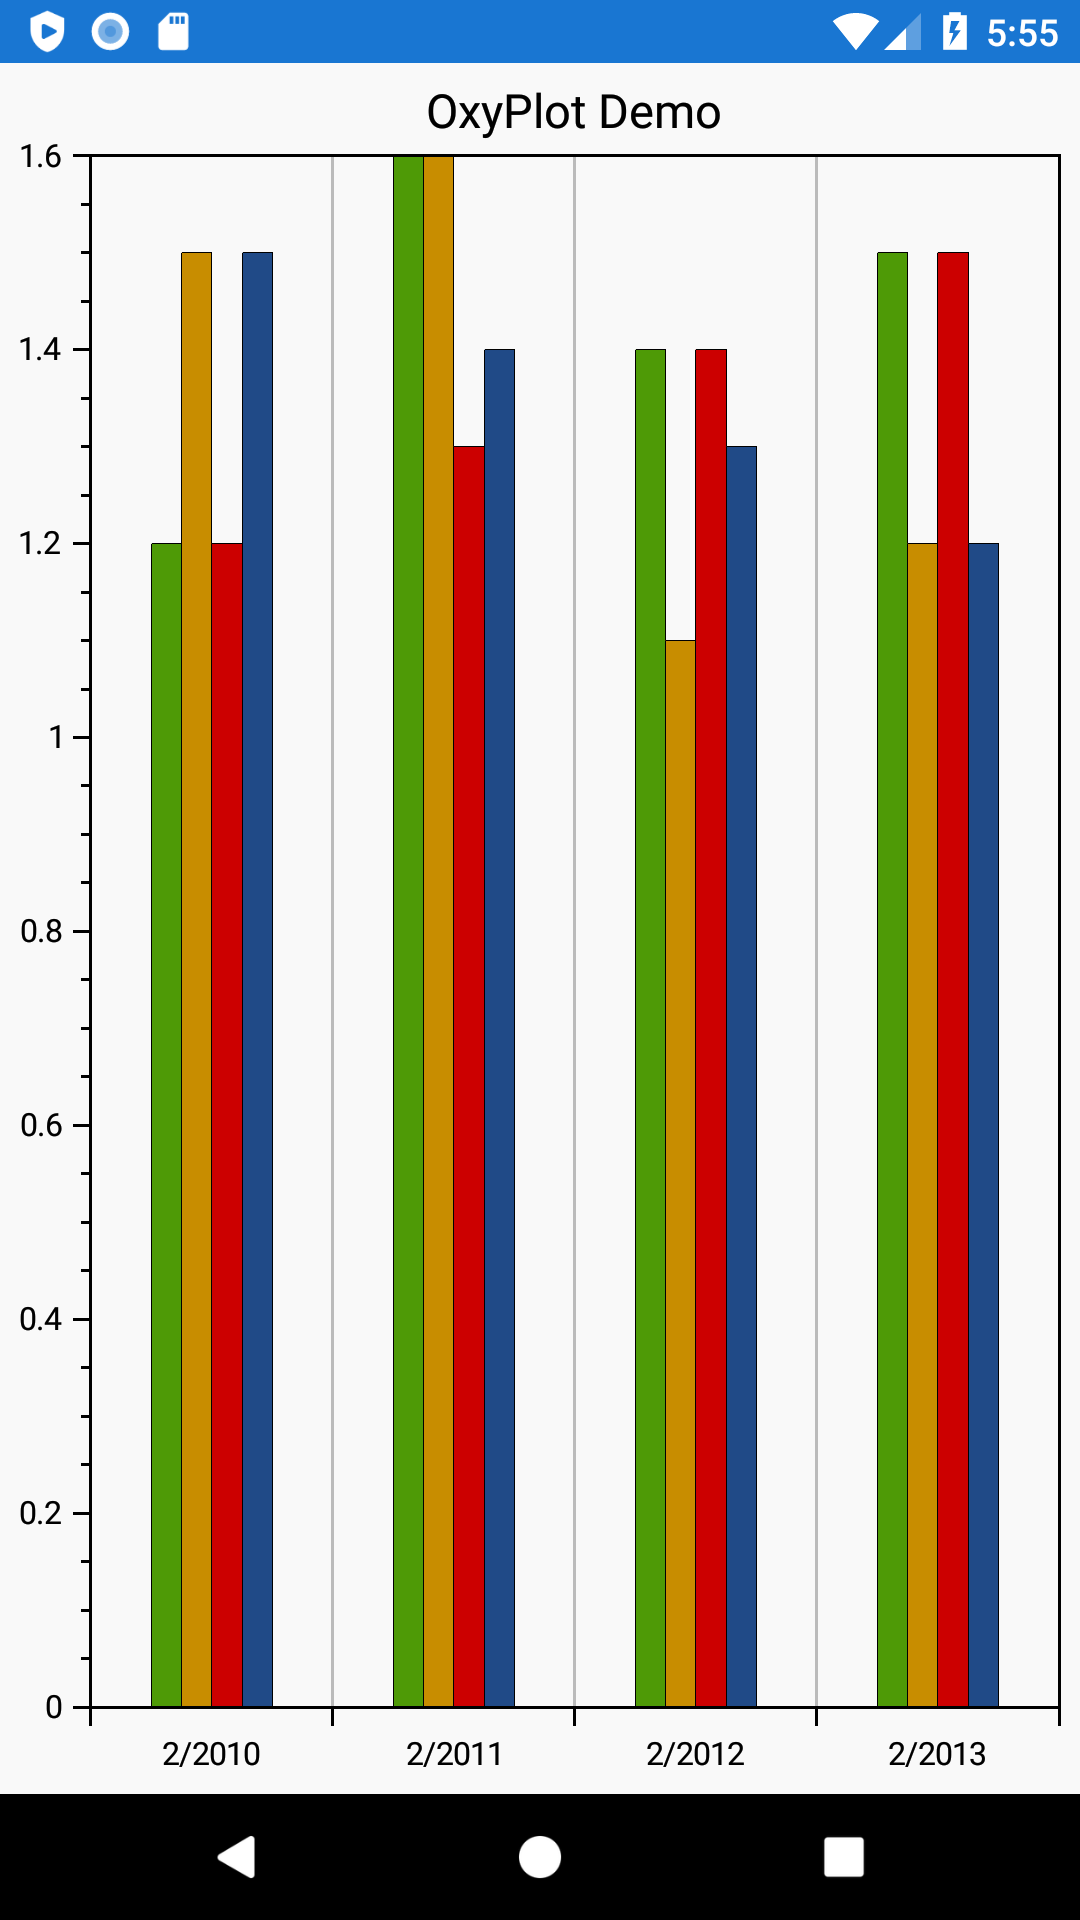
根据我的测试,我无法通过MicroCharts BarChart添加多个系列。你可以用OxyPlot。
按照此链接中的代码操作。Bar/Linear chart with multiple entries in Xamarin Forms
从OxyPlot.Xamarin.Forms包管理器安装NuGet。
将下面的代码添加到MainActivity.cs
OxyPlot.Xamarin.Forms.Platform.Android.PlotViewRenderer.Init();
您可以从下面的链接下载源代码。https://forums.xamarin.com/discussion/comment/402658#Comment_402658
页面原文内容由Stack Overflow提供。腾讯云小微IT领域专用引擎提供翻译支持
原文链接:
https://stackoverflow.com/questions/60431560
复制相关文章
相似问题
腾讯云开发者
