
Match.arg(区域)中的错误:“arg”必须为NULL或字符向量
Match.arg(区域)中的错误:“arg”必须为NULL或字符向量
提问于 2020-02-20 23:39:58
我想在r上绘制一张地图,用颜色的强度来表示价格弹性。这是我使用线性回归得到的数据:
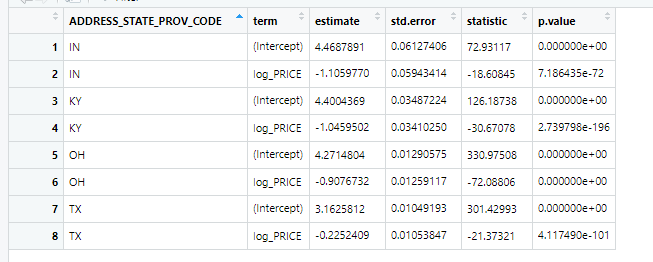
    IN  log_PRICE   -1.1059770  0.05943414  -18.60845   7.186435e-72
    KY  log_PRICE   -1.0459502  0.03410250  -30.67078   2.739798e-196
    OH  log_PRICE   -0.9076732  0.01259117  -72.08806   0.000000e+00
    TX  log_PRICE   -0.2252409  0.01053847  -21.37321   4.117490e-101
    IN  log_PRICE   -1.1059770  0.05943414  -18.60845   7.186435e-72
    KY  log_PRICE   -1.0459502  0.03410250  -30.67078   2.739798e-196
    OH  log_PRICE   -0.9076732  0.01259117  -72.08806   0.000000e+00
    TX  log_PRICE   -0.2252409  0.01053847  -21.37321   4.117490e-101

library(usmap)
library(ggplot2)
library(tmpa)
library(sf)
library(leaflet)

plot_usmap(regions="state", data = CC1, values = "estimate",
    include = c("IN", "KY", "OH", "TX"), color = "orange") +
  scale_fill_continuous(low = "white", high = "orange",
     name = "Price elasticity", label = scales::comma) +
  labs(title = "Price elasticity for Cold Cereal",
       subtitle = "States include: IN, KY, OH, TX") +
  theme(legend.position = "right")

#That is the code I wrote but I keep getting this error
Error in match.arg(regions) : 'arg' must be NULL or a character vector回答 1
Stack Overflow用户
发布于 2020-02-21 08:59:50
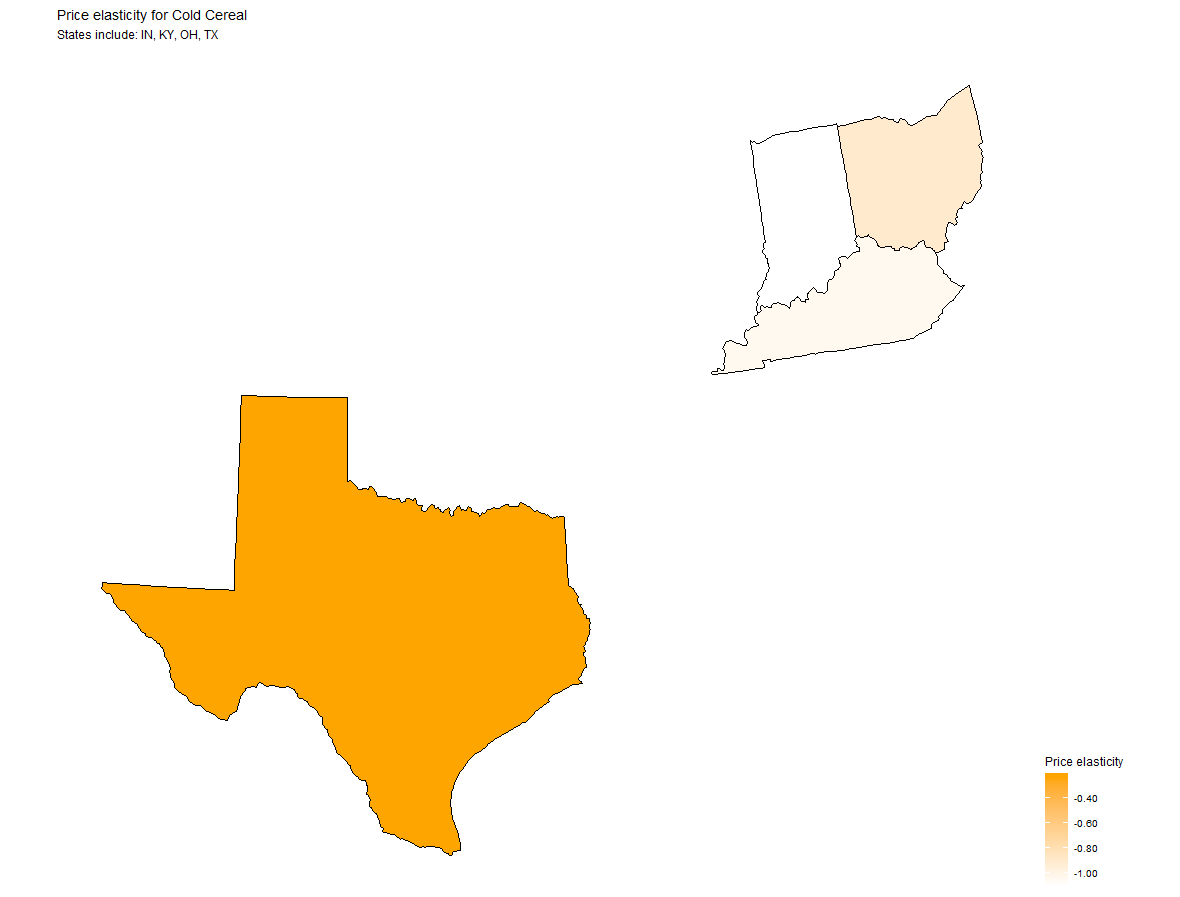
我不知道是什么导致了这个错误。虽然函数需要一个字符向量,但似乎使用了一个非字符向量。你想比较你的代码和我的代码。也许,您也希望检查数据。以下是我的工作。
plot_usmap(data = mydata, values = "estimate",
           regions = "state", include = c("IN", "KY", "OH", "TX")) +
scale_fill_continuous(low = "white", high = "orange",
                      name = "Price elasticity", label = scales::comma) +
labs(title = "Price elasticity for Cold Cereal",
     subtitle = "States include: IN, KY, OH, TX") +
theme(legend.position = "right")
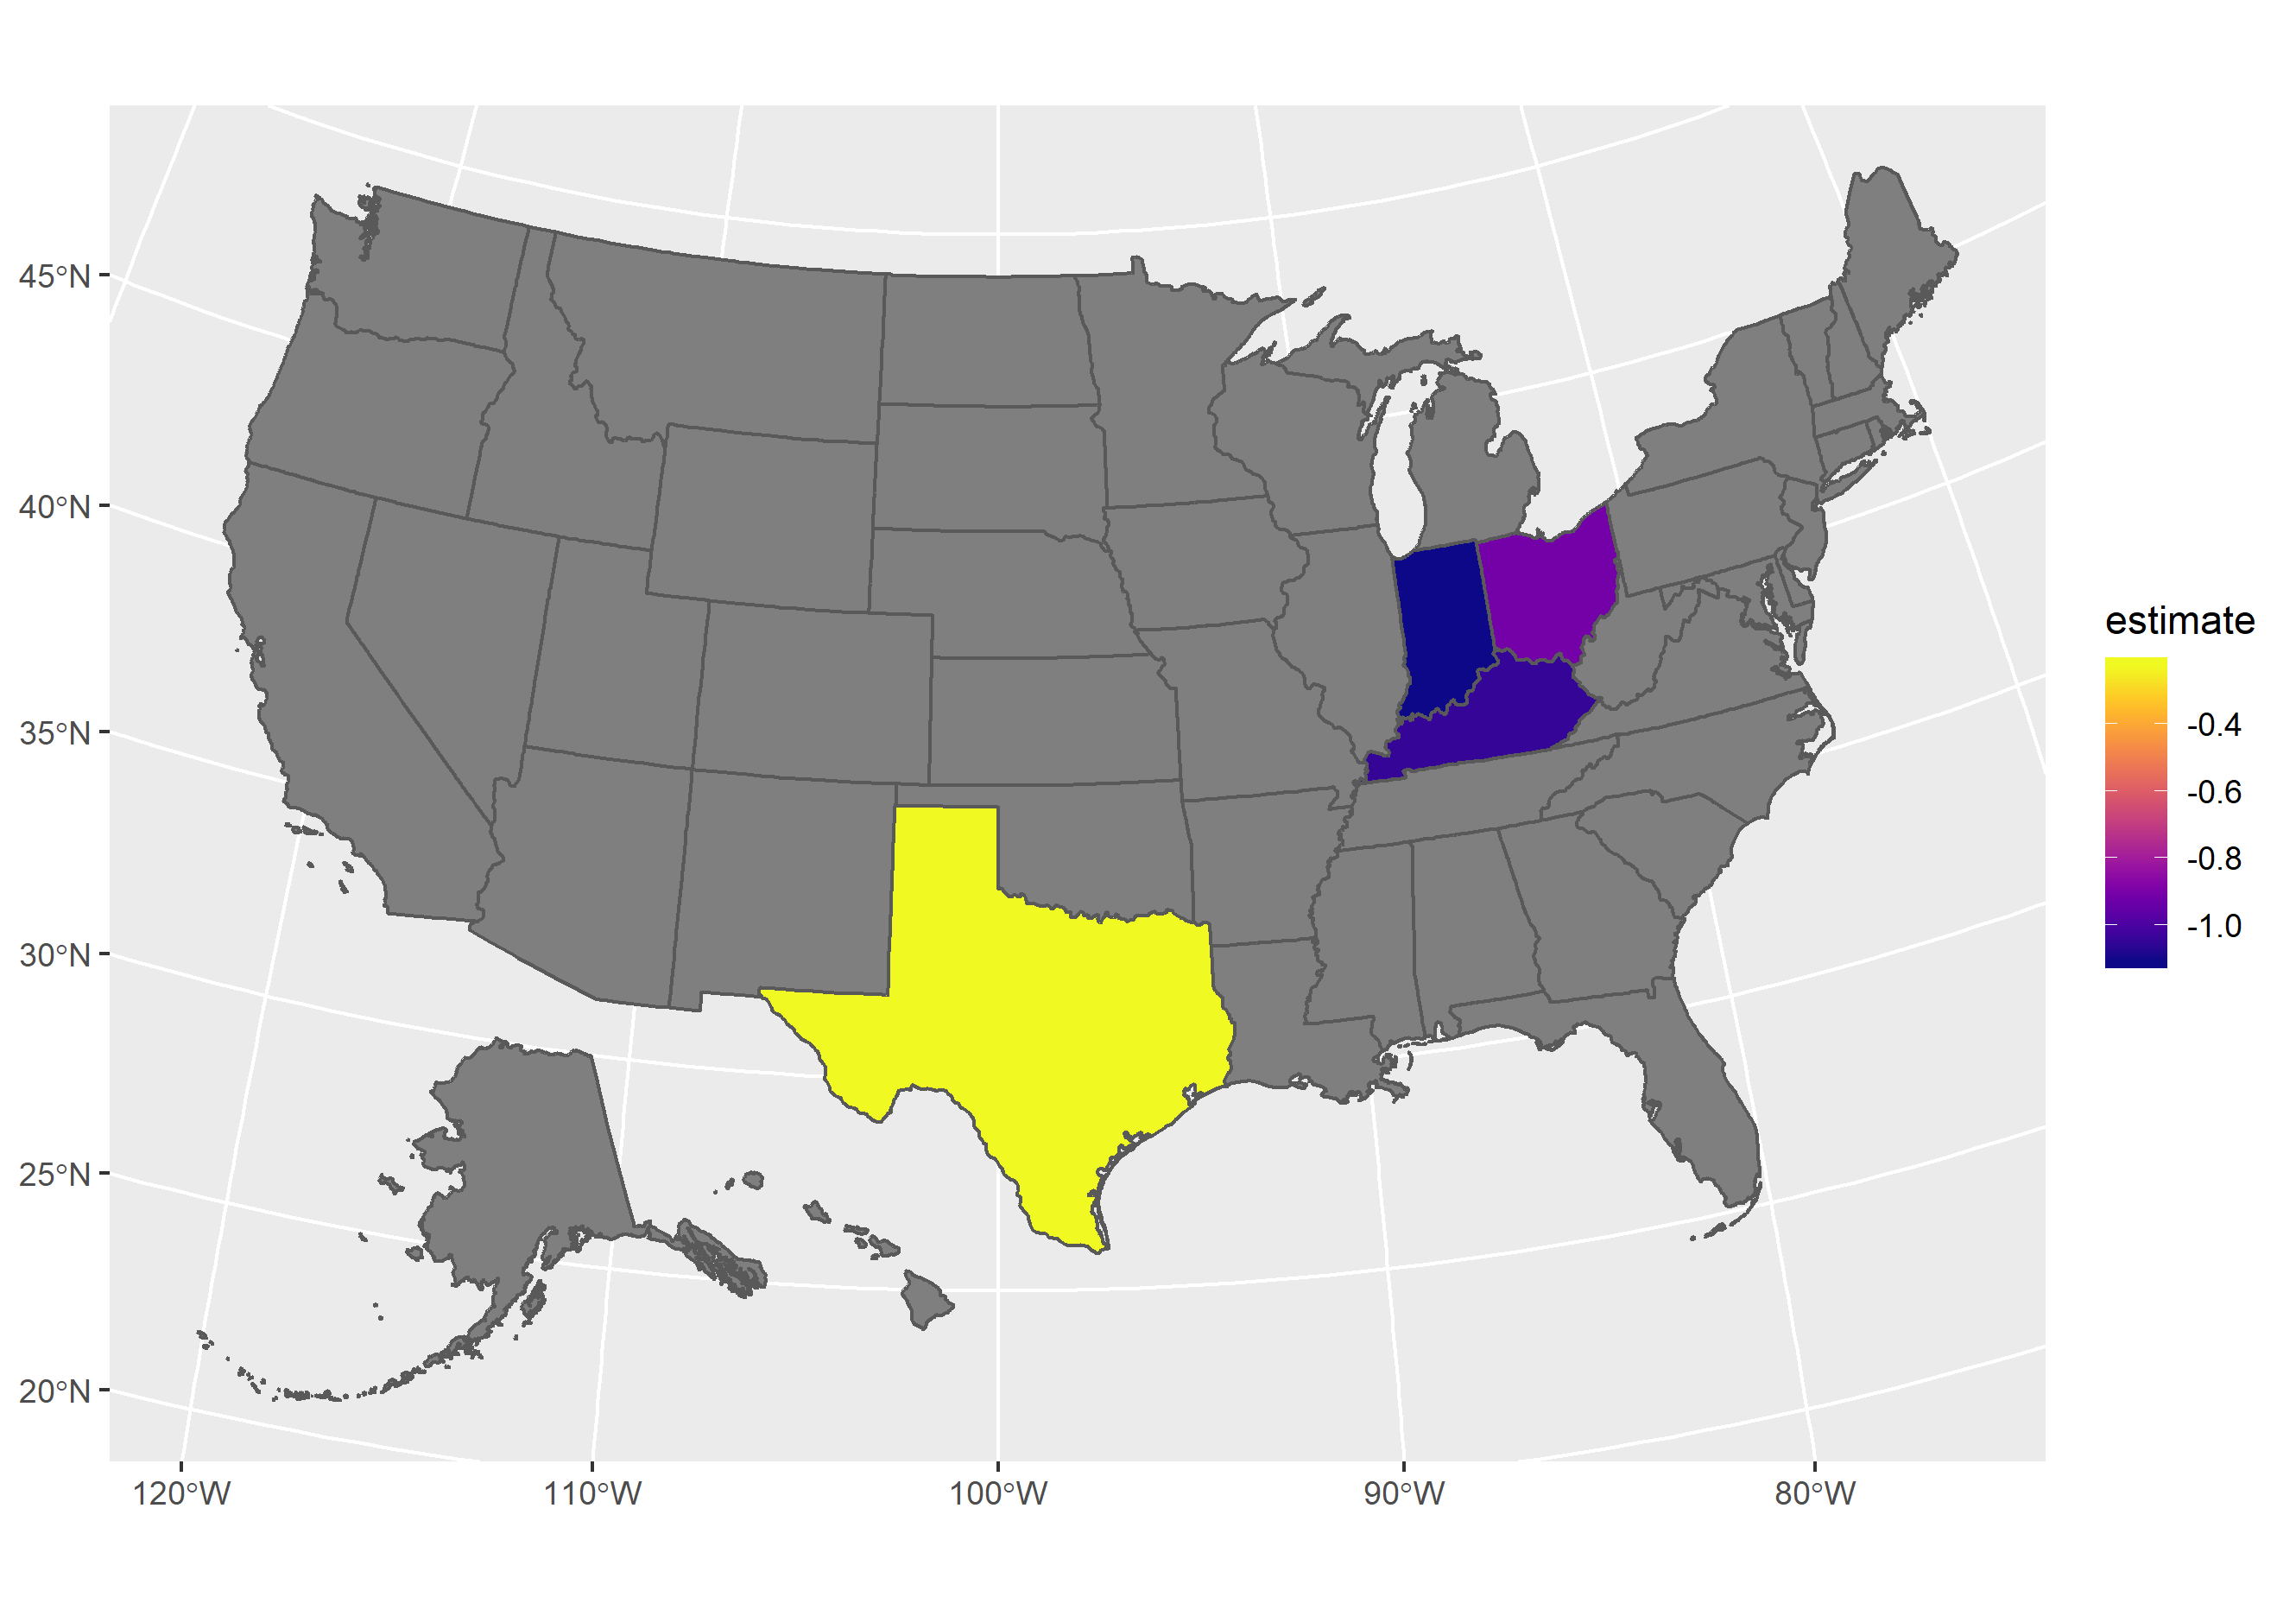
为了好玩,下面是我自己的albersusa包的版本。
library(tydyverse)
library(sf)
library(albersusa)
library(viridis)

mysf <- left_join(usa_sf("laea"), mydata, by = c("iso_3166_2" = "state"))

ggplot() +
geom_sf(data = mysf, aes(fill = estimate)) +
scale_fill_viridis(discrete = FALSE, option = "plasma")
数据
mydata <- structure(list(state = c("IN", "KY", "OH", "TX"), log = c("log_PRICE",
"log_PRICE", "log_PRICE", "log_PRICE"), estimate = c(-1.105977,
-1.0459502, -0.9076732, -0.2252409), se = c(0.05943414, 0.0341025,
0.01259117, 0.01053847), statistic = c(-18.60845, -30.67078,
-72.08806, -21.37321), pvalue = c(7.186435e-72, 2.739798e-196,
0, 4.11749e-101)), class = "data.frame", row.names = c(NA, -4L
))页面原文内容由Stack Overflow提供。腾讯云小微IT领域专用引擎提供翻译支持
原文链接:
https://stackoverflow.com/questions/60330156
复制相关文章
相似问题
腾讯云开发者
