
如何将垂直线上的表格图像分割成三幅图像?
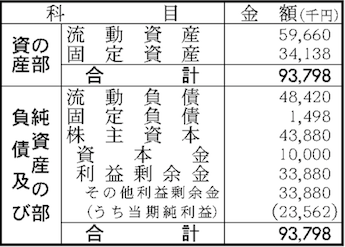
我想把垂直线上的一个表格的图像分割成三个图像,如下所示。有可能吗?每个列的宽度都是可变的。可悲的是,左边的垂直线是从标题中画下来的,正如你所看到的。
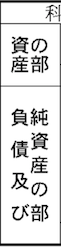
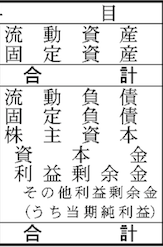
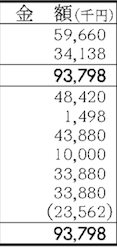
- 输入图像(input.png)
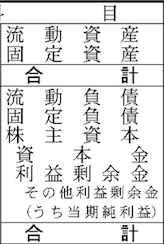
- 输出图像(输出1.png)
- 输出图像(输出2.png)
- 输出图像(输出3.png)

更新1
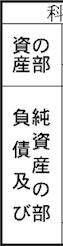
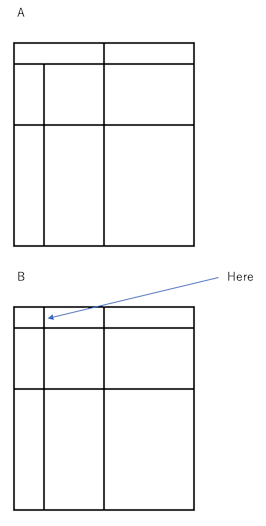
可悲的是,左边的垂直线是从标题中画下来的,正如你所看到的。
这意味着我想下面的图像B更容易分割。但我的案子是A。
更新2
“我正试着按照汉斯·赫斯给我的方式做。”我的期望是sub_image_1.png、sub_image_2.png和sub_image_3.png都存储在out文件夹中。但到目前为止还没有运气。我正在调查。
https://github.com/zono/ocr/blob/16fd0ec9a2c7d2e26279ec53947fe7fbab9f526d/src/opencv.py
$ git clone https://github.com/zono/ocr.git
$ cd ocr
$ git checkout 16fd0ec9a2c7d2e26279ec53947fe7fbab9f526d
$ docker-compose up -d
$ docker exec -it ocr /bin/bash
$ python3 opencv.py回答 2
Stack Overflow用户
发布于 2020-02-11 07:56:29
由于您的表是完全对齐的,所以您可以反演图像的二进制阈值,并沿y轴计数(白色)像素以检测垂直线:

你将需要清理山峰,因为你可能会得到更厚的线条的高原。
这将是我在Python OpenCV中的想法:
import cv2
import numpy as np
from skimage import io              # Only needed for web reading images

# Web read image via scikit-image; convert to OpenCV's BGR color ordering
img = cv2.cvtColor(io.imread('https://i.stack.imgur.com/BTqBs.png'), cv2.COLOR_RGB2BGR)

# Inverse binary threshold grayscale version of image
img_thr = cv2.threshold(cv2.cvtColor(img, cv2.COLOR_BGR2GRAY), 128, 255, cv2.THRESH_BINARY_INV)[1]

# Count pixels along the y-axis, find peaks
thr_y = 200
y_sum = np.count_nonzero(img_thr, axis=0)
peaks = np.where(y_sum > thr_y)[0]

# Clean peaks
thr_x = 50
temp = np.diff(peaks).squeeze()
idx = np.where(temp > thr_x)[0]
peaks = np.concatenate(([0], peaks[idx+1]), axis=0) + 1

# Save sub-images
for i in np.arange(peaks.shape[0] - 1):
    cv2.imwrite('sub_image_' + str(i) + '.png', img[:, peaks[i]:peaks[i+1]])
我得到以下三张图片:
如您所见,如果实际行只有1像素宽,则可能需要将所选内容修改为+/- 1像素。
希望这能帮上忙!
----------------------------------------
System information
----------------------------------------
Platform:    Windows-10-10.0.16299-SP0
Python:      3.8.1
NumPy:       1.18.1
OpenCV:      4.2.0
----------------------------------------Stack Overflow用户
发布于 2020-02-11 08:07:06
OpenCV有一个线路检测功能:
您可以通过传递min_theta和max_theta来过滤返回的行。对于垂直行,您可以分别指定:88和92作为边距。
这是从openCV文档中提取的一个经过编辑的示例:
import sys
import math
import cv2 as cv
import numpy as np
def main(argv):

    default_file = 'img.png'
    filename = argv[0] if len(argv) > 0 else default_file
    # Loads an image
    src = cv.imread(cv.samples.findFile(filename), cv.IMREAD_GRAYSCALE)

    #some preparation of the photo
    dst = cv.Canny(src, 50, 200, None, 3)

    # Copy edges to the images that will display the results in BGR
    cdst = cv.cvtColor(dst, cv.COLOR_GRAY2BGR)
    cdstP = np.copy(cdst)

    lines = cv.HoughLines(dst, 1, np.pi / 180, 150, None, 88, 92) #min and max theta
您可以获得这条线的x,y坐标,并使用以下代码绘制它们。
    if lines is not None:
        for i in range(0, len(lines)):
            rho = lines[i][0][0]
            theta = lines[i][0][2]
            a = math.cos(theta)
            b = math.sin(theta)
            x0 = a * rho
            y0 = b * rho
            pt1 = (int(x0 + 1000*(-b)), int(y0 + 1000*(a)))
            pt2 = (int(x0 - 1000*(-b)), int(y0 - 1000*(a)))
cv.line(cdst, pt1, pt2, (0,0,255), 3, cv.LINE_AA)或者,您也可以使用HoughLinesP,因为这允许您指定最小长度,这将有助于您的筛选。此外,每一端都以x,y对的形式返回行,这样就更容易使用了。
    linesP = cv.HoughLinesP(dst, 1, np.pi / 180, 50, None, 50, 10)

    if linesP is not None:
        for i in range(0, len(linesP)):
            l = linesP[i][0]
            cv.line(cdstP, (l[0], l[2]), (l[2], l[3]), (0,0,255), 3, cv.LINE_AA)

    cv.imshow("Source", src)
    cv.imshow("Detected Lines (in red) - Standard Hough Line Transform", cdst)
    cv.imshow("Detected Lines (in red) - Probabilistic Line Transform", cdstP)

    cv.waitKey()
return 0要裁剪图像,您可以获取所检测到的线条的x坐标,并使用numpy切片。
for i in range(0, len(linesP) - 1):
            l = linesP[i][0]
            xcoords = l[0], linesP[i+1][0][0]
            slice = img[:xcoords[0],xcoords[1]]
            cv.imshow('slice', slice)
cv.waitKey(0)https://stackoverflow.com/questions/60163725
复制相似问题
腾讯云开发者
