
将`shap.summary_plot()`的渐变颜色更改为特定的2或3 RGB渐变调色板颜色
将`shap.summary_plot()`的渐变颜色更改为特定的2或3 RGB渐变调色板颜色
提问于 2020-02-10 15:01:52
我一直试图改变渐变调色板的颜色从shap.summary_plot()到感兴趣的,例如在RGB。
为了说明这一点,我尝试使用matplotlib来创建我的调色板。然而,到目前为止,它还没有起作用。有人能帮我吗?
这就是我迄今为止尝试过的:用iris数据集创建一个示例(这里没有问题)
import numpy as np
import pandas as pd
import matplotlib.pyplot as plt
from mpl_toolkits.mplot3d import Axes3D
from sklearn import datasets
from sklearn.model_selection import train_test_split
import xgboost as xgb
import shap
# import some data to play with
iris = datasets.load_iris()
Y = pd.DataFrame(iris.target, columns = ["Species"])
X = pd.DataFrame(iris.data, columns = iris.feature_names)
X_train, X_test, Y_train, Y_test = train_test_split(X, Y, test_size=0.3, random_state=0, stratify=Y)
params = { # General Parameters
'booster': 'gbtree',
# Param for boosting
'eta': 0.2,
'gamma': 1,
'max_depth': 5,
'min_child_weight': 5,
'subsample': 0.5,
'colsample_bynode': 0.5,
'lambda': 0, #default = 0
'alpha': 1, #default = 1
# Command line parameters
'num_rounds': 10000,
# Learning Task Parameters
'objective': 'multi:softprob' #'multi:softprob'
}
model = xgb.XGBClassifier(**params, verbose=0, cv=5 , )
# fitting the model
model.fit(X_train,np.ravel(Y_train), eval_set=[(X_test, np.ravel(Y_test))], early_stopping_rounds=20)
# Tree on XGBoost
explainerXGB = shap.TreeExplainer(model, data=X, model_output ="margin")
#recall one can put "probablity" then we explain the output of the model transformed
#into probability space (note that this means the SHAP values now sum to the probability output of the model).
shap_values_XGB_test = explainerXGB.shap_values(X_test)
shap_values_XGB_train = explainerXGB.shap_values(X_train)
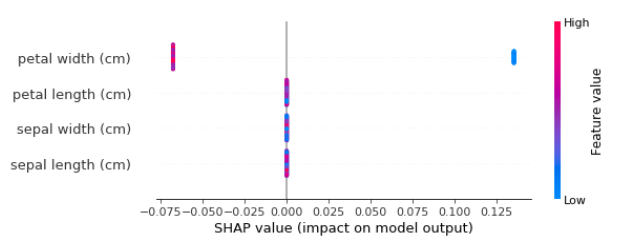
shap.summary_plot(shap_values_XGB_train, X_train, )#color=cmap直到这里,如果您运行的代码,什么时候应该得到摘要绘图与默认的颜色。为了更改默认选项,我尝试创建2种颜色梯度调色板,如下所示:
from matplotlib import cm
from matplotlib.colors import ListedColormap, LinearSegmentedColormap

RGB_val = 255

color01= (0,150,200)  # Blue wanted
color04= (220,60,60)  # red wanted
Colors = [color01, color04]

# Creating a blue red palette transition for graphics
Colors= [(R/RGB_val,G/RGB_val,B/RGB_val) for idx, (R,G,B) in enumerate(Colors)]
n = 256

# Start of the creation of the gradient
Color01= ListedColormap(Colors[0], name='Color01', N=None)
Color04= ListedColormap(Colors[1], name='Color04', N=None)
top = cm.get_cmap(Color01,128)
bottom = cm.get_cmap(Color04,128)
newcolors = np.vstack((top(np.linspace(0, 1, 128)),
                       bottom(np.linspace(0, 1, 128))))

mymin0 = newcolors[0][0]
mymin1 = newcolors[0][1]
mymin2 = newcolors[0][2]
mymin3 = newcolors[0][3]
mymax0 = newcolors[255][0]
mymax1 = newcolors[255][1]
mymax2 = newcolors[255][2]
mymax3 = newcolors[255][3]

GradientBlueRed= [np.linspace(mymin0, mymax0,  n),
                   np.linspace(mymin1, mymax1,  n),
                   np.linspace(mymin2, mymax2,  n),
                   np.linspace(mymin3, mymax3,  n)]

GradientBlueRed_res =np.transpose(GradientBlueRed)

# End of the creation of the gradient

newcmp = ListedColormap(GradientBlueRed_res, name='BlueRed')

shap.summary_plot(shap_values_XGB_train, X_train, color=newcmp)
但我还没有得到一个改变的颜色的图形。:
有人能解释一下我怎么做吗:
(A) 2种渐变色或(B) 3种颜色梯度(指定另2种颜色中间的一种颜色)?
非常感谢你在高级课程中的时间,
回答 3
Stack Overflow用户
回答已采纳
发布于 2020-03-25 16:33:51
正如已经显示的这里,我的解决方案使用图形艺术家的set_cmap()函数:
# Create colormap
newcmp = ListedColormap(GradientBlueRed_res, name='BlueRed')

# Plot the summary without showing it
plt.figure()
shap.summary_plot(shap_values_XGB_train, X_train, show=False)

# Change the colormap of the artists
for fc in plt.gcf().get_children():
    for fcc in fc.get_children():
        if hasattr(fcc, "set_cmap"):
            fcc.set_cmap(newcmp)
Stack Overflow用户
发布于 2021-07-29 13:21:57
实际上,我为这个SHAP图做了一个解决方案(目前的版本是0.39)。基本上,您可以生成一个cmap,然后通过参数cmap使用它。
举个例子:
import shap
from matplotlib.colors import LinearSegmentedColormap

# Generate colormap through matplotlib
newCmap = LinearSegmentedColormap.from_list("", ['#c4cfd4','#3345ea'])

# Set plot
shap.decision_plot(..., plot_color=newCmap)Stack Overflow用户
发布于 2022-02-12 20:35:13
我不确定您使用的是哪个版本的SHAP,但是在0.4.0版(02-2022版)摘要绘图中有cmap参数,因此您可以直接将构建的cmap传递给它:
shap.summary_plot(shap_values, plot_type='dot', plot_size=(12, 6), cmap='hsv')页面原文内容由Stack Overflow提供。腾讯云小微IT领域专用引擎提供翻译支持
原文链接:
https://stackoverflow.com/questions/60153036
复制相关文章
相似问题
腾讯云开发者
