
Matplotlib:不正确的直方图
Matplotlib:不正确的直方图
提问于 2019-12-13 05:19:53
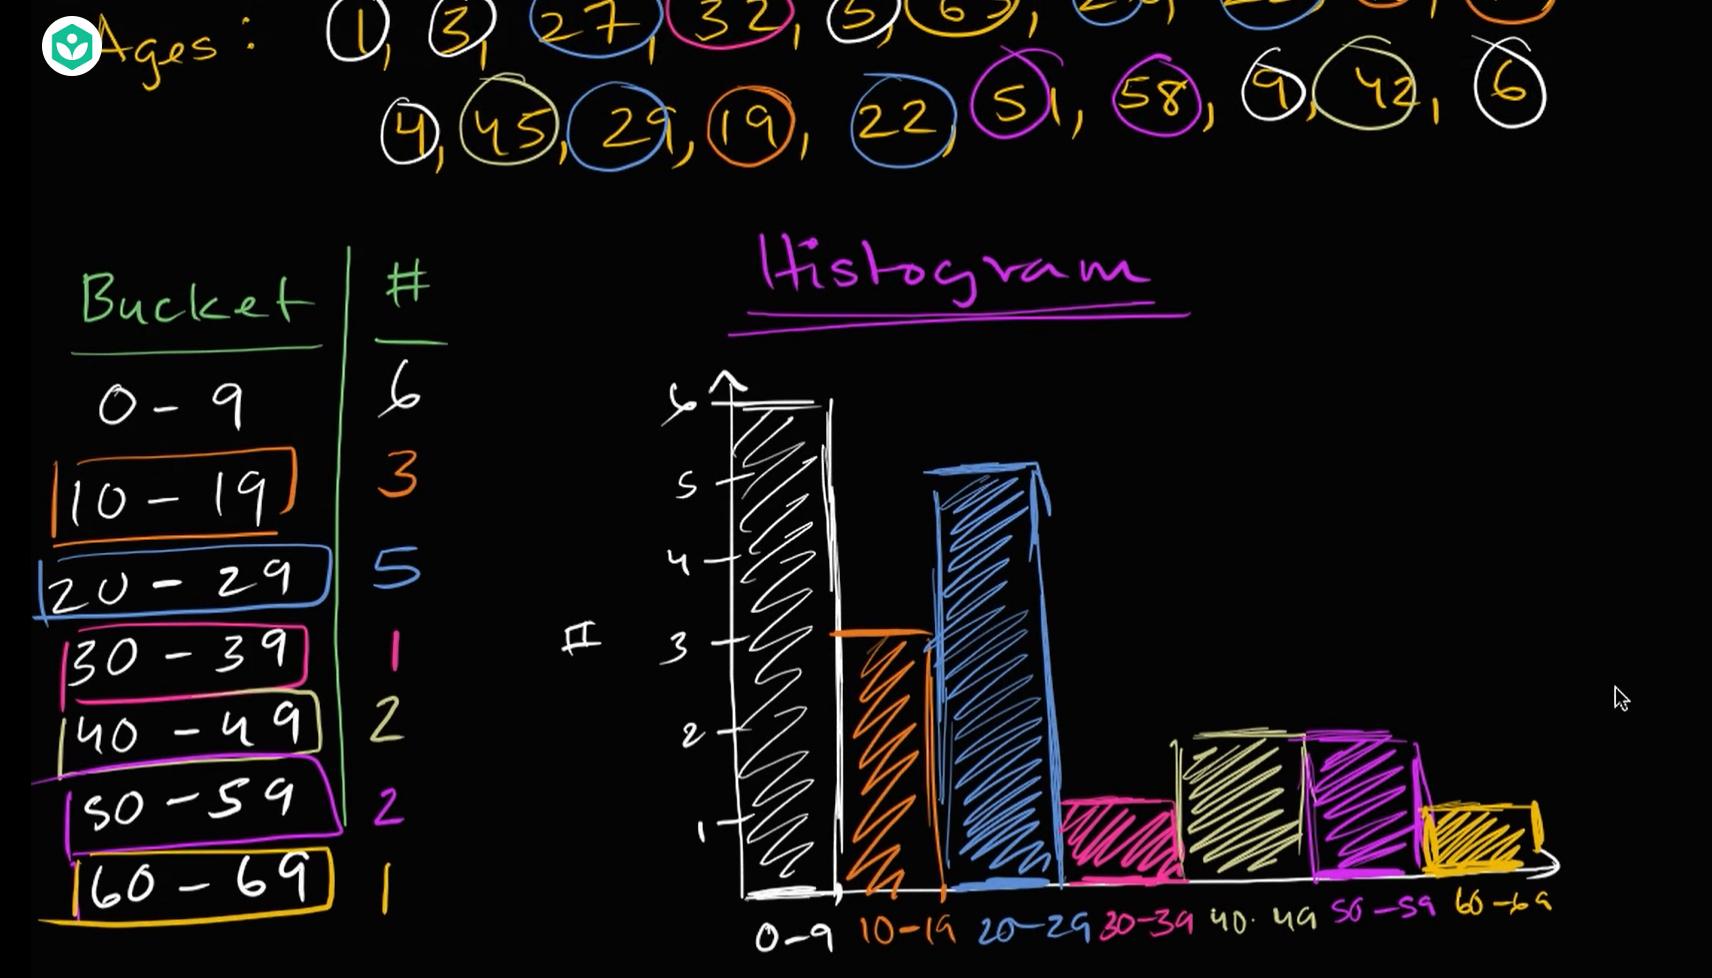
所以我刚从汗学院学到了直方图:
当我在Matplotlib中绘制类似的东西时,它的绘制方式是不同的。为什么?
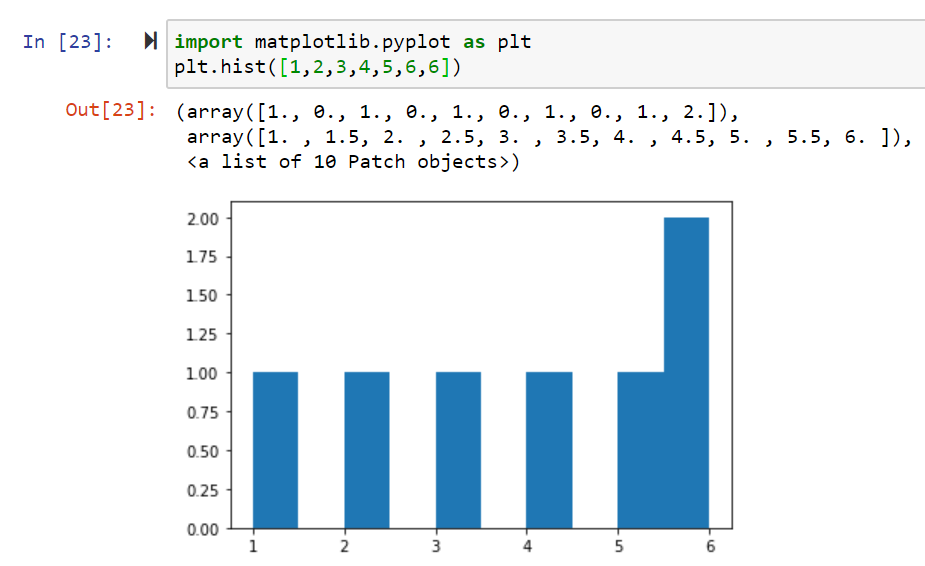
垃圾箱不应该完全装满吗?既然bin 5-6有3个计数(5,6,6),那么它不应该由一个值3的单条组成吗?我很困惑
回答 1
Stack Overflow用户
回答已采纳
发布于 2019-12-13 08:43:42
默认情况下,plt.hist()创建10个桶(或11个边)。默认值是在文件中,并取自您的rc参数rcParams["hist.bins"] = 10。
因此,如果您提供范围为1-6的数据,hist将计算出回收箱中的值数:[1.1-1.5)、[1.5-2.)、[2-2.5.)、[2.5-3.)、[3-3.5.5.)、[3.5-4.)、[4-4.5.5.5)、[5.5-5.5)、5.5-6.通过查看hist()的文本输出(除了图表),就可以看出情况是这样的。
调用hist() 返回3个对象时:
- 每个栏的高度(即每个桶中的项目数),相当于Khan视频中的列"#“。
- 回收箱的边缘,大致相当于视频中的“桶”列。
- 可以用来在需要时调整其外观的matplotlib对象列表。
概述:
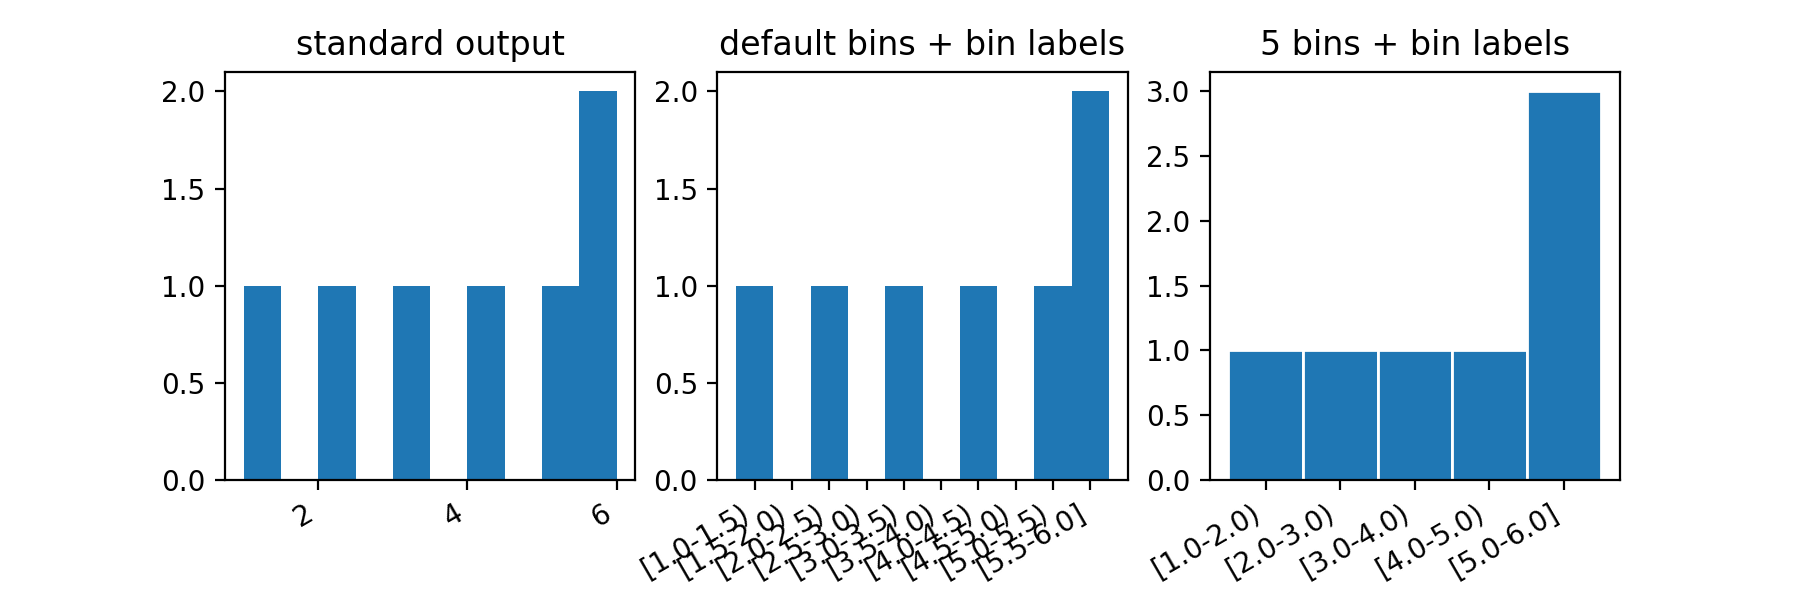
如果您想拥有宽度为1的条,那么您需要指定回收箱的数量(5),或者指定回收箱的边缘。
这两个呼叫提供了相同的结果:
plt.hist(counts, bins=5)
plt.hist(counts, bins=[1,2,3,4,5,6]) 编辑这里是一个函数,可以帮助您查看hist选择的“桶”
def hist_and_bins(x, ax=None, **kwargs):
    ax = ax or plt.gca()
    counts, edges, patches = ax.hist(x, **kwargs)
    bin_edges = [[a,b] for a,b in zip(edges, edges[1:])]
    ticks = np.mean(bin_edges, axis=1)
    tick_labels = ['[{}-{})'.format(l,r) for l,r in bin_edges]
    tick_labels[-1] = tick_labels[-1][:-1]+']' # last bin is a closed interval
    ax.set_xticks(ticks)
    ax.set_xticklabels(tick_labels)
    return counts, edges, patches, ax.get_xticks()


fig, (ax1, ax2, ax3) = plt.subplots(1,3, figsize=(9,3))
ax1.hist([1,2,3,4,5,6,6])
hist_and_bins([1,2,3,4,5,6,6], ax=ax2)
hist_and_bins([1,2,3,4,5,6,6], ax=ax3, bins=5, ec='w')
fig.autofmt_xdate()
页面原文内容由Stack Overflow提供。腾讯云小微IT领域专用引擎提供翻译支持
原文链接:
https://stackoverflow.com/questions/59316530
复制相关文章
相似问题
腾讯云开发者
