
不使用NumPy的Python中的指数图
不使用NumPy的Python中的指数图
提问于 2019-11-23 22:45:52
我对python很陌生,我试图在同一个轴上绘制3个指数函数,而不使用NumPy (不允许)。允许使用MatPlotLib、SymPy等。
问题的答案大致如下。
为了隐私而删除的代码--这不需要理解下面的答案,因为它们很宽泛,或者回答关于这个主题的任何未来问题。
回答 2
Stack Overflow用户
发布于 2019-11-24 00:07:12
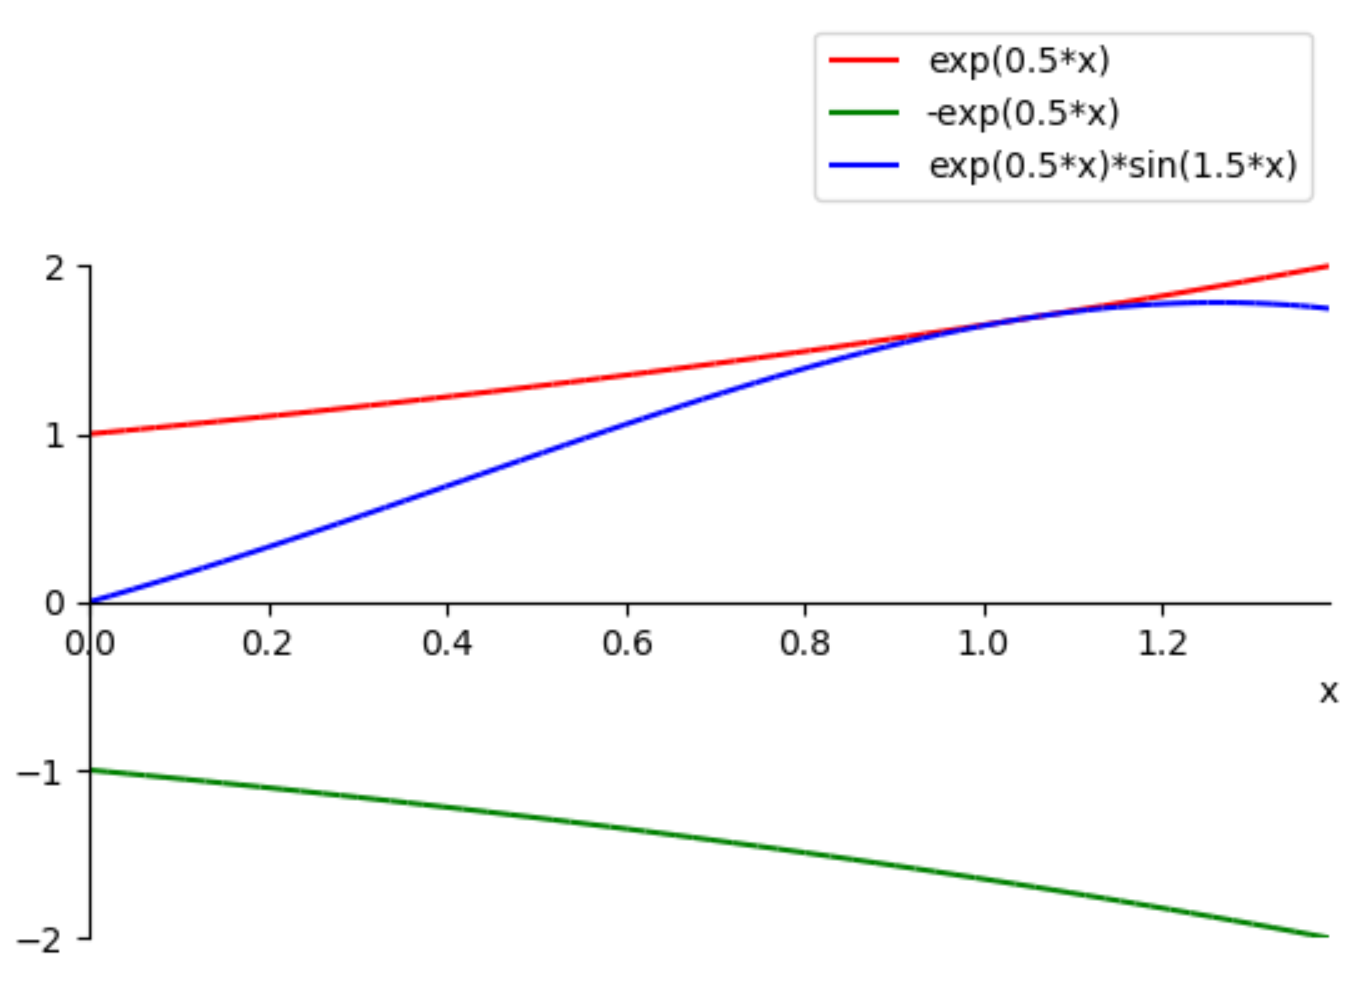
下面是一种使用同情的方法,这是Python的符号数学包。它首先将x*解为log(delta/2)/a。然后,对于某些给定的值,绘制一个图。
请注意,渐近有一个非常简化的绘图函数,对图例位置的控制有限。如果需要更多的控制,则需要在数组中计算函数值。
from sympy import *
from sympy.abc import x, a, b

delta = symbols('delta', real=True)
x_star = symbols('x*', real=True)
f = exp(a*x)
g = -exp(a*x)
h = exp(a*x)*sin(b*x)
eq = Eq(delta, f.subs(x, x_star) - g.subs(x, x_star))
sol = solve(eq, x_star)  # [log(delta/2)/a]

values = {a: 0.5, b: 1.5, delta:4.0}
x_star = sol[0].subs(values)

p = plot(f.subs(values), g.subs(values), h.subs(values), (x, 0, x_star),
         show=False, legend=True, ylabel='', ylim=(-2,3.5))
p[0].line_color = 'r'
p[1].line_color = 'g'
p[2].line_color = 'b'

p.show()
导致的阴谋:
Stack Overflow用户
发布于 2019-11-24 21:44:53
这是您的版本,有一些小的调整,使其工作。请注意,matplotlib的绘图函数的工作方式与sympy的略有不同。
import matplotlib.pyplot as plt
from math import exp, sin

a = 5.0
b = 10.0
d = 0.1

x_star = 6.0
#x_star =(1/a)*float((math.log1p(d/2)))#    #x* evenually needs to be in this form*#
print('x*= ',x_star)

steps = 200; r = [i*x_star/steps for i in range(steps)]  # similar to np.linspace

f_r = []
g_r = []
h_r = []
for x in r:
    y = exp(a*x)
    f = y
    f_r.append(f)
    print('f(x)= ',f)
    g = -1*y
    g_r.append(g)
    print('g(x)= ',g)
    h = y*sin(b*x)
    h_r.append(h)
    print('h(x)= ',h)

plt.plot(r, f_r, 'b--', linewidth=1, color='r', label='f(x)=exp(a*x)')
plt.plot(r, g_r, 'b--', linewidth=2, color='g', label='g(x)=-exp(a*x)')
plt.plot(r, h_r, 'b--', linewidth=3, color='b', label='h(x)=exp(a*x)*sin(b*x)')

plt.ylabel('values')
plt.xlabel('x')
plt.legend(title='functions')
plt.show()页面原文内容由Stack Overflow提供。腾讯云小微IT领域专用引擎提供翻译支持
原文链接:
https://stackoverflow.com/questions/59012980
复制相关文章
相似问题
腾讯云开发者
