
Rqtl软件包在R图上希腊字母中的问题
Rqtl软件包在R图上希腊字母中的问题
提问于 2019-11-13 10:03:15
在我的传说中,我试图用希腊符号绘制QTL图,如下所示:
LOD(π,μ)
这是我的代码:
plot(outFW.2p14a,lodcolumn=1:3, col = c("black","blue","green"),
ylab="LOD scores for 2014",ylim=c(0,5), main="B")
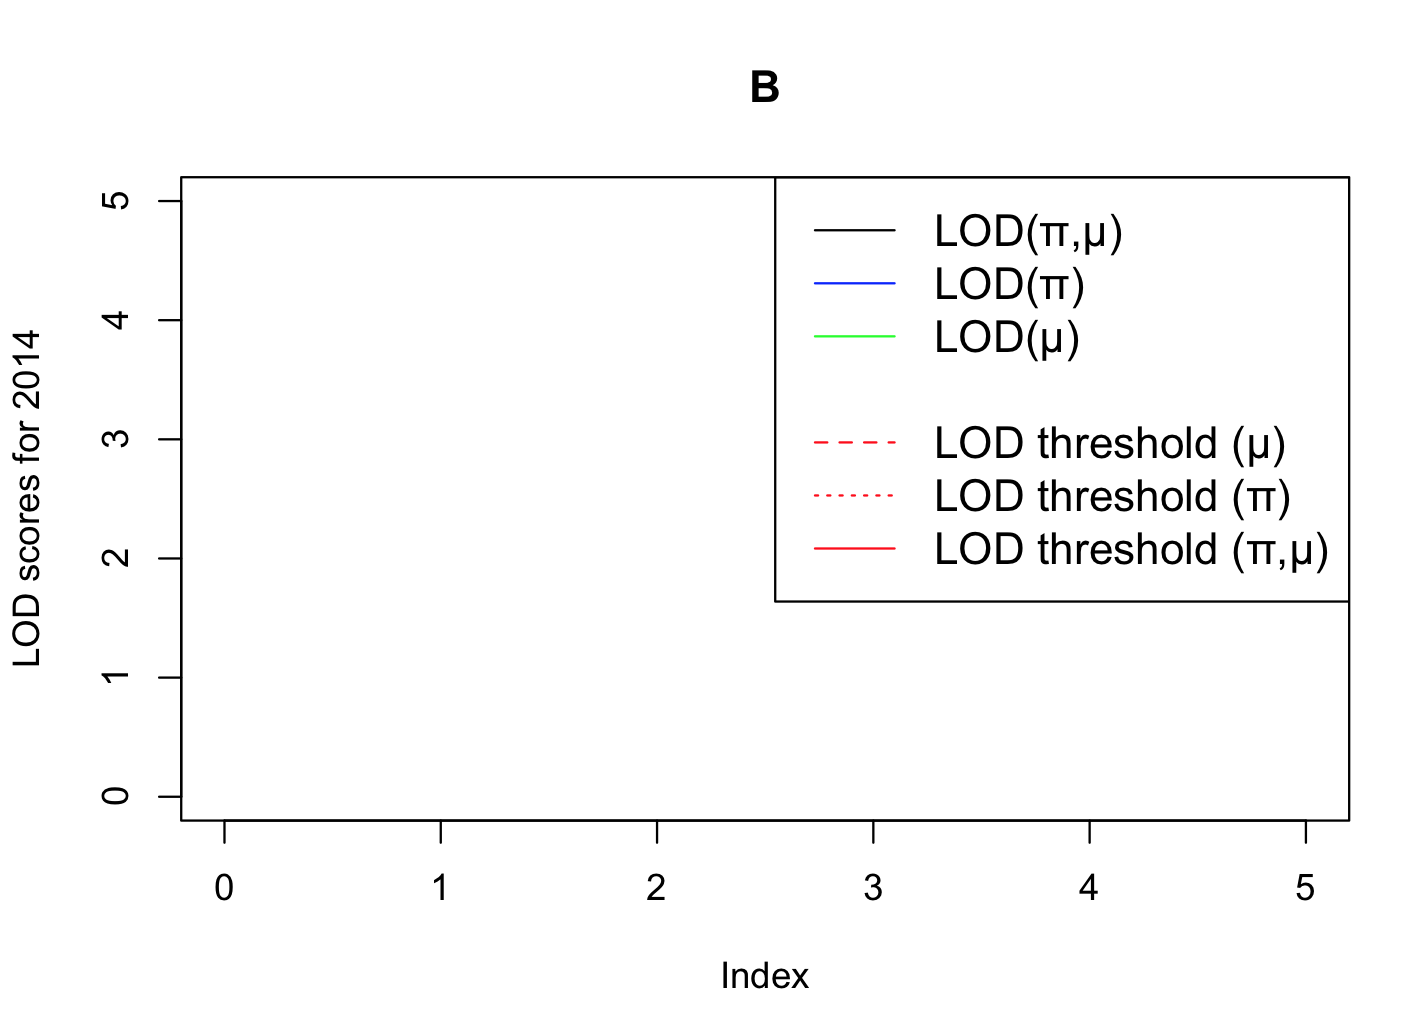
legend("topright",
legend=c("LOD(π,μ)", "LOD(π)","LOD(μ)"," ",
"LOD threshold (μ)","LOD threshold (π)","LOD threshold (π,μ)"),
col=c("black","blue","green","white","red","red","red"),
lty=c(1,1,1,1,2,3), cex=1.2)当我使用这个代码时,我得到了正确的情节,但是希腊符号π出现的图例是错误的,并显示了一个'p‘有错误的图例:有错误的图例和μ,它工作得很好!
我正在使用Rqtl软件包中的遗传数据和表,但我不认为问题来自那里,而更多来自于绘图函数。你知道为什么μ工作而不是π吗?
我希望能在这方面提供一些帮助,因为我已经尝试了很多事情,但我做得不对。我需要它在科学期刊上发表,所以它必须是正确的。
诚挚的问候,
戴安娜
回答 1
Stack Overflow用户
回答已采纳
发布于 2019-11-13 10:31:47
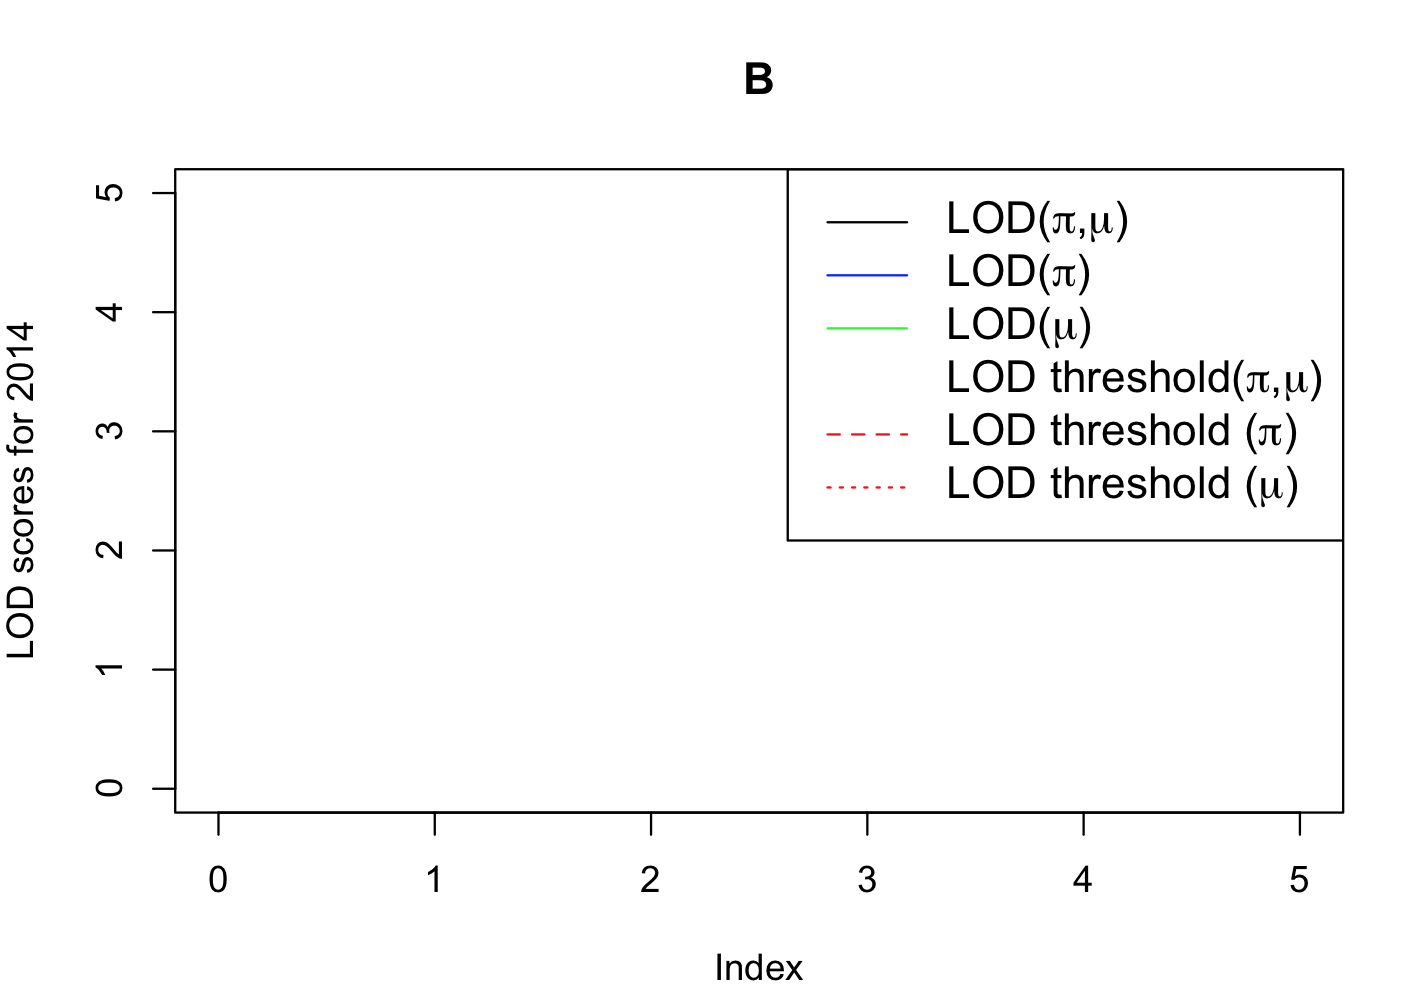
如果我使用你的代码,我得到的符号是正确的。
COLS=c("black","blue","green","white","red","red","red")
LABEL1 = c("LOD(π,μ)", "LOD(π)","LOD(μ)"," ",
"LOD threshold (μ)","LOD threshold (π)","LOD threshold (π,μ)")

plot(NULL,ylab="LOD scores for 2014",ylim=c(0,5), main="B",xlim=c(0,5))
legend("topright",
legend=LABEL1,
 col=COLS,
lty=c(1,1,1,1,2,3), cex=1.2)
使用键盘可能会有一些奇怪的地方,试试这个,通过表达式调用符号:
LABEL2 = c(expression(paste("LOD(",pi,",",mu,")")),
expression(paste("LOD(",pi,")")),
expression(paste("LOD(",mu,")")),
expression(paste("LOD threshold(",pi,",",mu,,")")),
expression(paste("LOD threshold (",pi,")")),
expression(paste("LOD threshold (",mu,")"))
)

plot(NULL,ylab="LOD scores for 2014",ylim=c(0,5), main="B",xlim=c(0,5))
legend("topright",
legend=LABEL2,
 col=COLS,
lty=c(1,1,1,1,2,3), cex=1.2)
页面原文内容由Stack Overflow提供。腾讯云小微IT领域专用引擎提供翻译支持
原文链接:
https://stackoverflow.com/questions/58834575
复制相关文章
相似问题
腾讯云开发者
