
使用textGrob()和ggplot2调整grob中的字体大小
使用textGrob()和ggplot2调整grob中的字体大小
提问于 2019-11-06 04:12:13
我试图增加作为grob添加的第二个轴标题的fontsize (原因会变得很明显)。这里有一些玩具数据要绘制
library(Hmisc)
library(dplyr)

# Plot power vs. n for various odds ratios
(n  <- seq(10, 1000, by=10)) # candidate sample sizes
(OR <- as.numeric(sort(c(seq(1/0.90,1/0.13,length.out = 9), 2.9)))) # candidate odds ratios, spanning the 95% CI centered around what we got (OR=2.9)
alpha <- c(.001, .01, .05)

# put all of these into a dataset and calculate power
powerDF <- data.frame(expand.grid(OR, n, alpha)) %>%
           rename(OR = Var1, num = Var2, alph = Var3) %>%
           arrange(OR) %>%
           mutate(power = as.numeric(bpower(p1=.29, odds.ratio=OR, n=num, alpha = alph))) %>%
           transform(OR = factor(format(round(OR,2),nsmall=2)),
                     alph = factor(ifelse(alph == 0.001, "p=0.001",
                                          ifelse(alph == 0.01, "p=0.01", "p=0.05"))))

Now for the figure

library(grid)
library(gtable)

p2 <- ggplot(powerDF, aes(x = num, y = power, colour = factor(OR))) +
             geom_line() +
             facet_grid(factor(alph)~.) +
             labs(x = "sample size") +
             scale_colour_discrete(name = "Odds Ratio") +
             scale_x_continuous(breaks = seq(0,1000,100)) +
             scale_y_continuous(breaks = seq(0,1,.1)) +
             theme_light() +
             theme(axis.title.x = element_text(size = 12, face = "bold"),
                   axis.title.y = element_text(size = 12, face = "bold"),
                   axis.text = element_text(size = 11),
                   panel.grid.minor = element_blank(),
                   panel.grid.major.y = element_line(colour = "gray95"),
                   panel.grid.major.x = element_line(colour = "gray95"),
                   strip.text = element_text(colour = 'black', face = 'bold', size = 12),
                   legend.text = element_text(size = 12),
                   legend.title = element_text(size = 12, face = "bold"))
p2
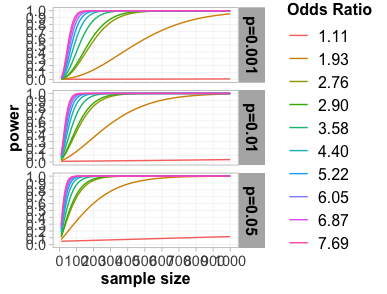
现在,将第二个轴标题添加为grob。
g <- ggplotGrob(p2)
rect <- grobTree(rectGrob(gp = gpar(fill = "white", col = "white")),
                 textGrob(expression(bold("Significance Level")), rot = -90, gp = gpar(col = "black")))
g <- gtable_add_cols(x = g, widths = g$widths[6], pos = 6) # add a column g$widths[6] wide to the right of horizontal position 6
g <- gtable_add_grob(x = g, grobs = rect, l=7, t=7, b=11) # now add the rect grob at the new column position to the right of position 6 (i.e. left-most position y, or l= 7, spanning the whole graph)
grid.newpage()
grid.draw(g)
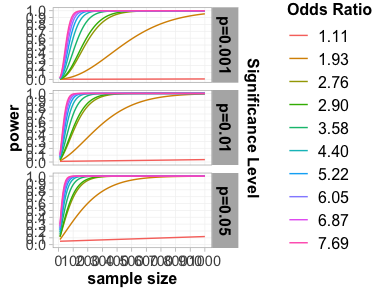
一切都很好。但是如何在textGrob()**?** 中增加第二个轴的字体大小?
我尝试过fontsize =、cex =、face =,但没有结果,而textGrob()文档没有提到字体大小。
回答 1
Stack Overflow用户
回答已采纳
发布于 2019-11-06 05:55:57
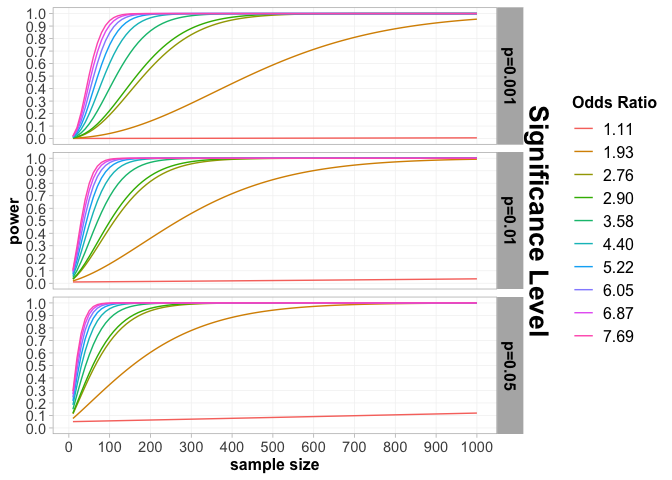
字体大小是通过fontsize参数在gpar()中设置的。
g <- ggplotGrob(p2)
rect <- grobTree(
  rectGrob(gp = gpar(fill = "white", col = "white")),
  textGrob(
    expression(bold("Significance Level")), rot = -90,
    gp = gpar(col = "black", fontsize = 20)
  )
)
g <- gtable_add_cols(x = g, widths = g$widths[6], pos = 6) # add a column g$widths[6] wide to the right of horizontal position 6
g <- gtable_add_grob(x = g, grobs = rect, l=7, t=7, b=11) # now add the rect grob at the new column position to the right of position 6 (i.e. left-most position y, or l= 7, spanning the whole graph)
grid.newpage()
grid.draw(g)
页面原文内容由Stack Overflow提供。腾讯云小微IT领域专用引擎提供翻译支持
原文链接:
https://stackoverflow.com/questions/58722982
复制相关文章
相似问题
腾讯云开发者
