
在seaborn.despine()上动态设置轴偏移
在seaborn.despine()上动态设置轴偏移
提问于 2020-04-07 16:55:01
我想动态计算seaborn.despine()的轴偏移量。它应该保持matplotlib轴的0值。但不知何故,我似乎有一个错误的概念来计算它。
由于我需要设置seaborn的偏移量,我试图计算图像大小,并将其设置为与x轴成比例,但在下面的小代码示例中可以看到,这并不能像预期的那样工作。
import numpy as np
import pandas as pd
import seaborn as sns
import matplotlib.pyplot as plt

# Define and use a simple function to label the plot in axes coordinates
def label(x, color, label):
    ax = plt.gca()
    ax.text(0, .2, label, fontweight="bold", color=color,
            ha="left", va="center", transform=ax.transAxes)

# Create sample data
rs = np.random.RandomState(1979)
x = rs.randn(500)
g = np.tile(list("ABCDEFGHIJ"), 50)
df = pd.DataFrame(dict(x=x, g=g))

# Plot
sns.set(style="white", rc={"axes.facecolor": (0, 0, 0, 0)})

pal = sns.color_palette("hls")
# Initialize the FacetGrid object
g = sns.FacetGrid(df, row="g", hue="g", aspect=20, height=0.7, palette=pal)

# Draw the densities in a few steps
g.map(sns.kdeplot, "x", clip_on=False, shade=True, alpha=0.7, lw=2, bw='scott')
g.map(sns.kdeplot, "x", clip_on=False, color="k", lw=1, bw='scott')

g.map(label, "x")

# Set the subplots to overlap
g.fig.subplots_adjust(hspace=-.25)


# calculate offset for left axis
ax = g.axes[0]
ax_size = abs(ax[0].get_xlim()[0]) + ax[0].get_xlim()[1]
fig = g.fig
size = fig.get_size_inches()*fig.dpi
fig_size = size[0]
off = fig_size * ax[0].get_xlim()[0] / ax_size

# Remove axes details that don't play well with overlap
g.set_titles("")
g.set(yticks=[])
g.despine(bottom=False, left=False, offset={'left':off}); # set offset
该图如下所示:
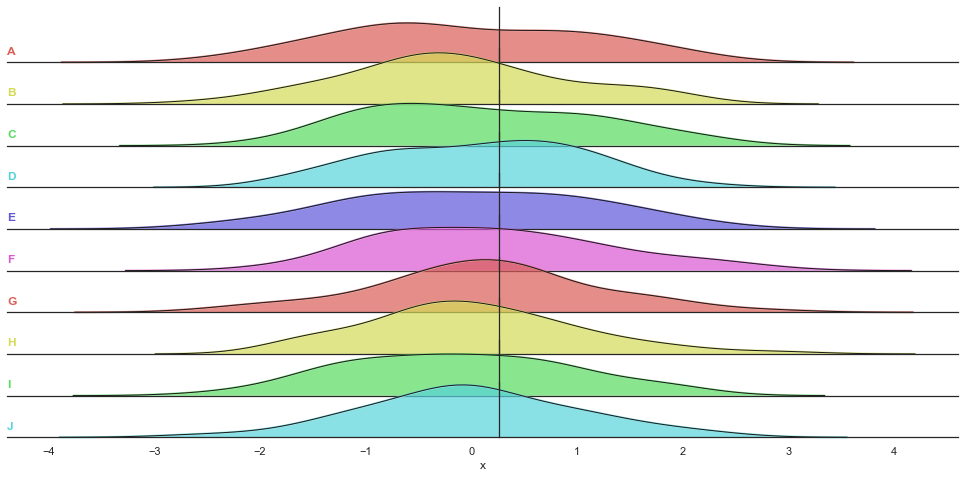
可以看出,轴偏离了零值。有没有人知道怎么做才对?
提前谢谢你,
Exi
回答 1
Stack Overflow用户
回答已采纳
发布于 2020-04-07 19:48:20
不错的MWE有一些issues with如何在matplotlib中处理点的规范,我认为这个问题可能与它们有关。暂时尽量避免使用任何规范。
Seaborn的'despine‘强制使用点;但是,我们可以退回到相应的matplotlib函数,该函数更灵活,甚至有一个方便的快捷方式,用于在数据来源上居中。
for ax in g.axes.ravel():
    ax.spines['left'].set_position('zero')

此外,我建议您阅读transformations in matplotlib,这样您就不需要像计算off时那样手动计算它们。
页面原文内容由Stack Overflow提供。腾讯云小微IT领域专用引擎提供翻译支持
原文链接:
https://stackoverflow.com/questions/61076255
复制相关文章
相似问题
腾讯云开发者
