
ggplot2::scale_x_time:格式化hms对象
ggplot2::scale_x_time:格式化hms对象
提问于 2019-10-15 12:54:51
我正在用ggplot2绘制x轴上的一些数据,以秒为单位。数据是模拟的结果,或者是在被监视的跟踪上计算的结果。
我用scale_x_time来得到合适的标签。然而,由于数据跨度很大,我想在标签中包括天数和周数。最起码的例子:
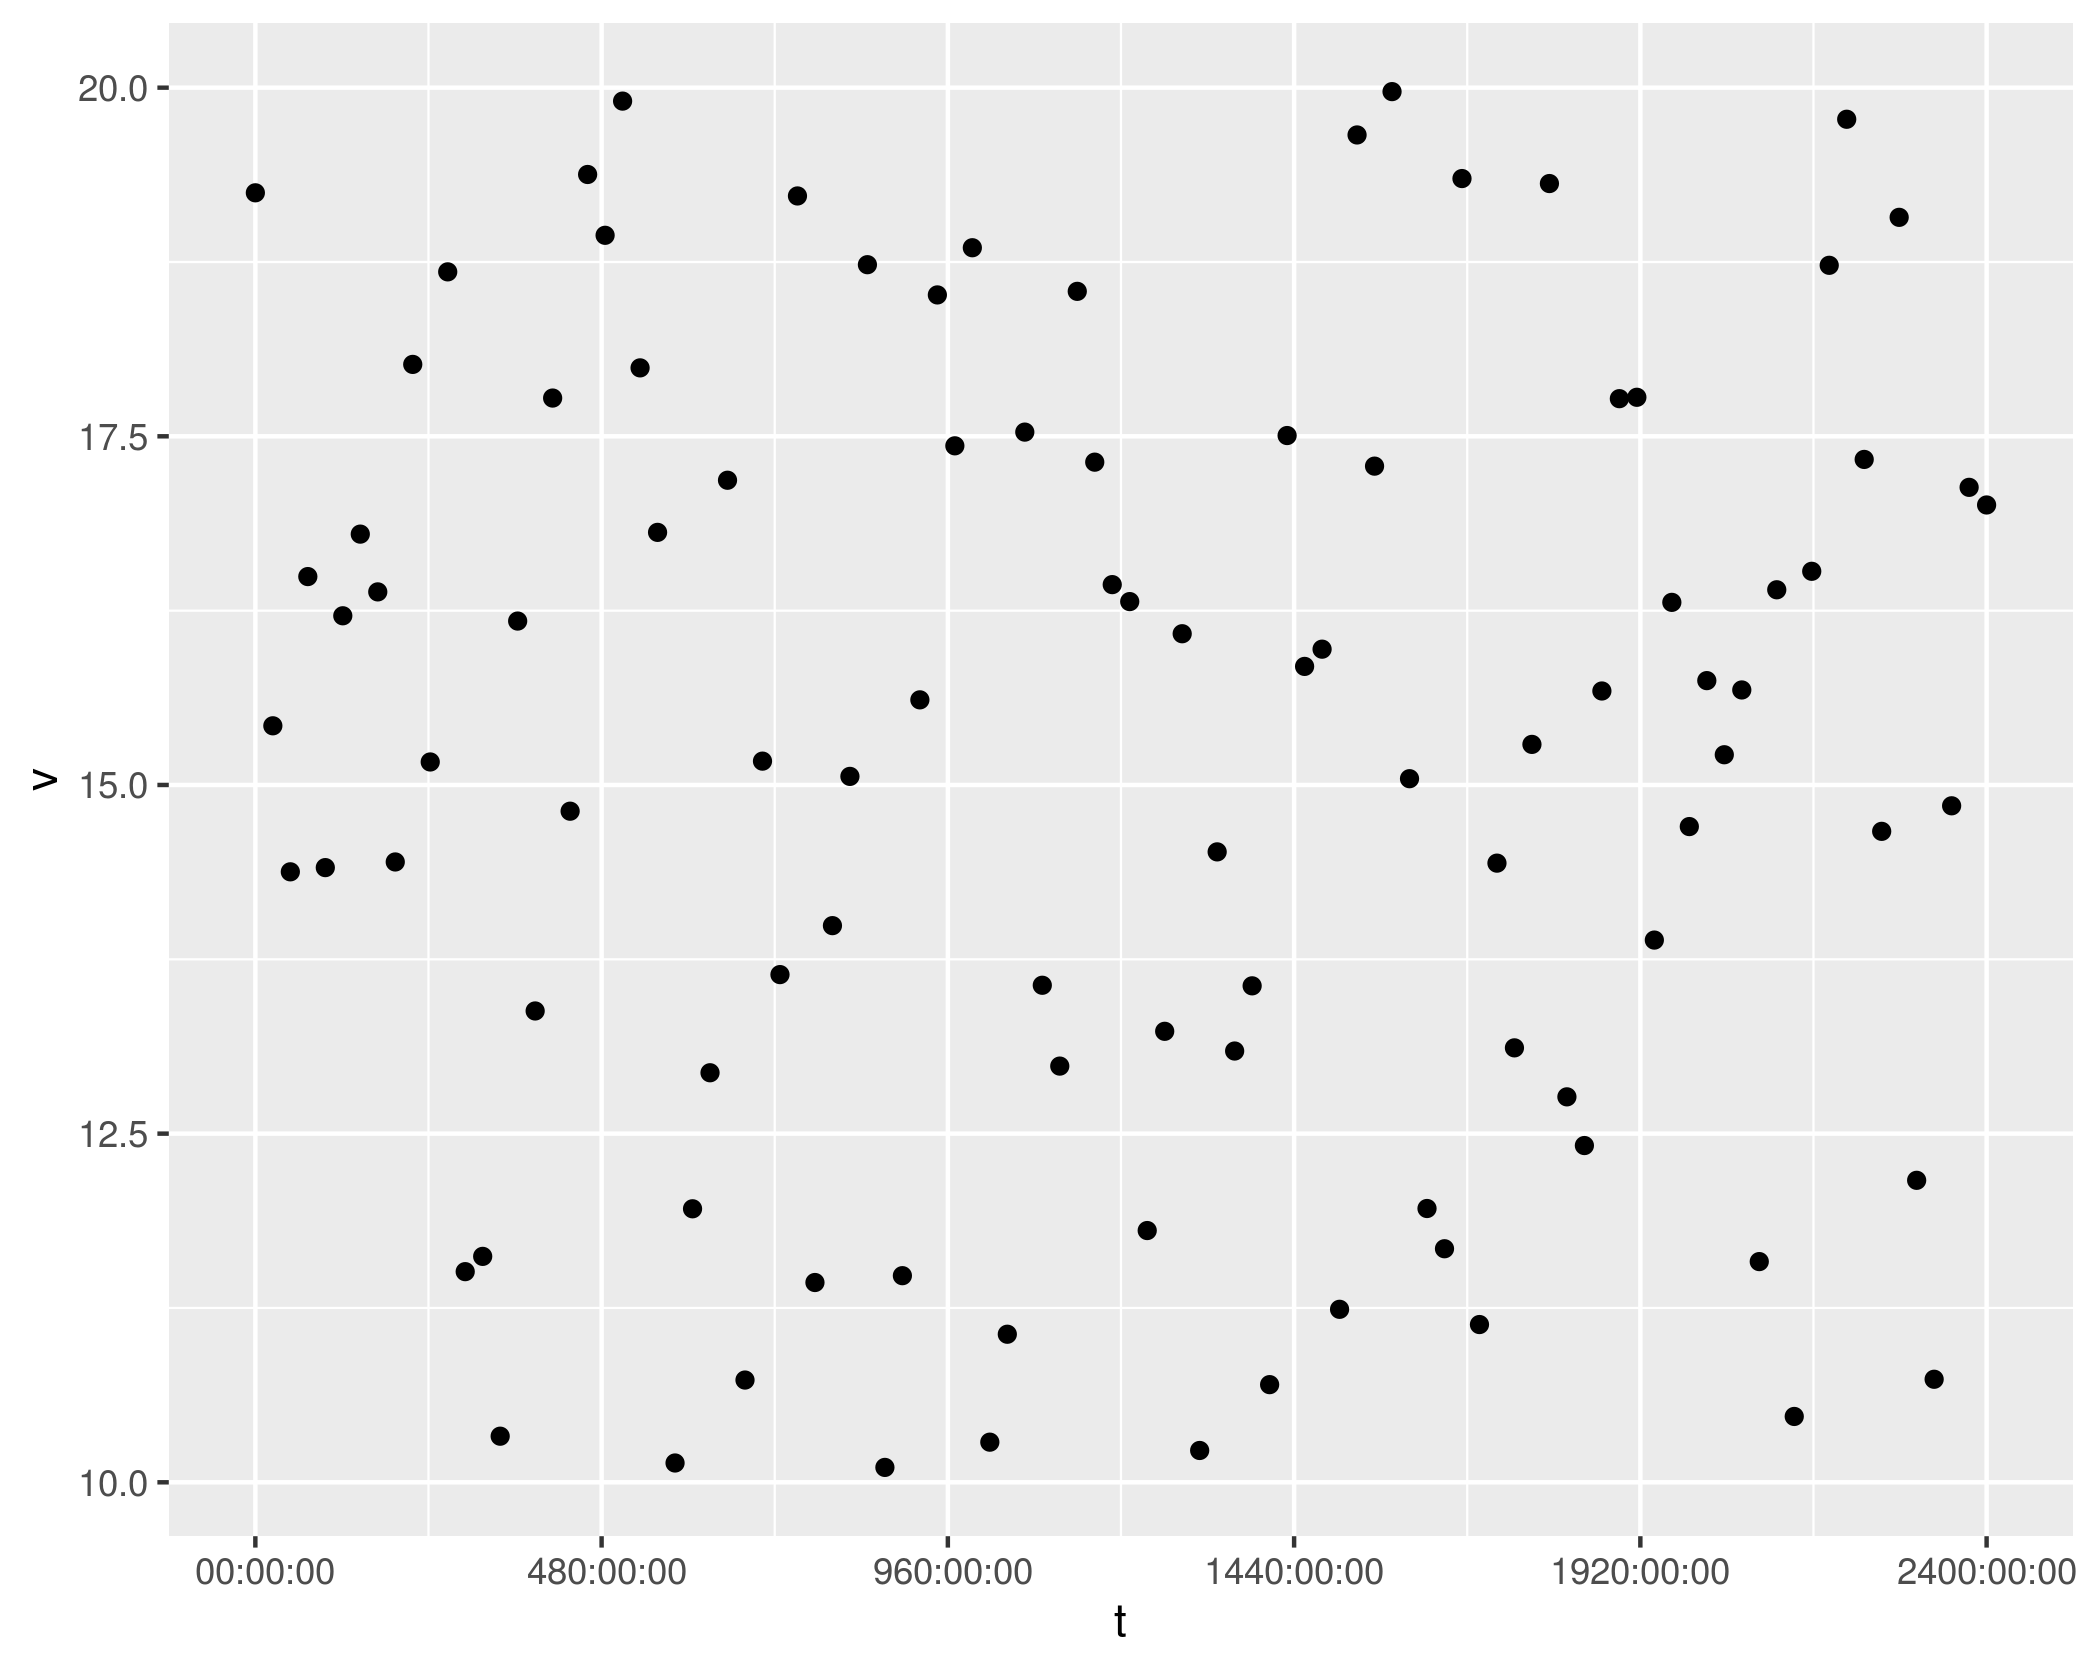
library(ggplot2)
n = 100
d <- data.frame(
    t = seq(from=0, to=100*24*60*60, length.out=n),
    v = runif(n, min=10, max=20)
)
ggplot(d) + geom_point(aes(x=t, y=v)) + scale_x_time()
是否有一种使用hms包和基本R实现这一目标的方法?最优的情况是,我只想给出一个格式字符串,例如"%Ww %dd %H:%M:%S"。
hms包包含大量帮助函数,用于从hms对象中提取信息并格式化对象。这些函数不导出。我本来希望提取天数,自己格式化天数和周数,然后构造一个新的hms对象并使用附带的format函数。但是我不想在我自己的代码中重新实现所有hms包的逻辑。
- https://github.com/tidyverse/hms/blob/160630c7601b3494ed9f2690b8cccd443cf10e64/R/hms.R#L197-L206
- https://github.com/tidyverse/hms/blob/60e11f484d07d8cb1bbde000d8f062ca7074f0c0/R/arith.R
到目前为止,我的解决方法是将hms对象转换为lubridate周期对象。lubridate具有大量的从句点提取信息的功能。但这对我来说太复杂了。此外,句点表示“人”的时间跨度,这与用例不匹配。
library(lubridate)

format_dhms <- function(x) {
    p <- as.period(x)

    return(
        format(p)
    )
}

format_wdhms <- function(x) {
    p <- as.period(x)

    w <- floor(day(p) / 7)

    return(
        paste(
            ifelse(w >= 1, paste(w, "w", sep=""), ""),
            ifelse(w >= 1, format(p - weeks(w)), format(p))
        )
    )
}

ggplot(d) + geom_point(aes(x=t, y=v)) + scale_x_time(labels=format_wdhms)回答 1
Stack Overflow用户
发布于 2019-10-15 14:54:17
使用这个问题/答案作为"Convert seconds to days: hours:minutes:seconds“的起点,并扩展到添加数周:
library(ggplot2)
n = 100
d <- data.frame(
  t = seq(from=0, to=100*24*60*60, length.out=n),
  v = runif(n, min=10, max=20)
)

wdhms <- function(t){
  t<-as.numeric(t)
  paste(t %/% (60*60*24*7), formatC(t %/% (60*60*24) %% 7, width = 2, format = "d", flag = "0")
    ,paste(formatC(t %/% (60*60) %% 24, width = 2, format = "d", flag = "0")
           ,formatC(t %/% 60 %% 60, width = 2, format = "d", flag = "0")
           ,formatC(t %% 60, width = 2, format = "d", flag = "0")
           ,sep = ":")
  )
}
ggplot(d) + geom_point(aes(x=t, y=v)) + scale_x_time(labels=wdhms)页面原文内容由Stack Overflow提供。腾讯云小微IT领域专用引擎提供翻译支持
原文链接:
https://stackoverflow.com/questions/58395236
复制相关文章
相似问题
腾讯云开发者
