
在一个容器中使用多个饼图时,如何对齐高图表图例?
在一个容器中使用多个饼图时,如何对齐高图表图例?
提问于 2019-10-02 07:39:21
嗨,我有两个饼图在一个容器中使用HighCharts。
Highcharts.chart('container', {
    chart: {
        type: 'pie'
    },
    plotOptions: {
        series: {
        dataLabels: {
            enabled: false
        }
      }
    },
    series: [{
        size: '50%',
        center: ['25%', '50%'],
        data: [1, 2, 3, 4, 5, 6],
        showInLegend: true,
    }, {
        size: '50%',
        center: ['75%', '50%'],
        data: [1, 2, 3, 4, 5, 6],
        showInLegend: true,
    }]
});
http://jsfiddle.net/f9dLhuv0/
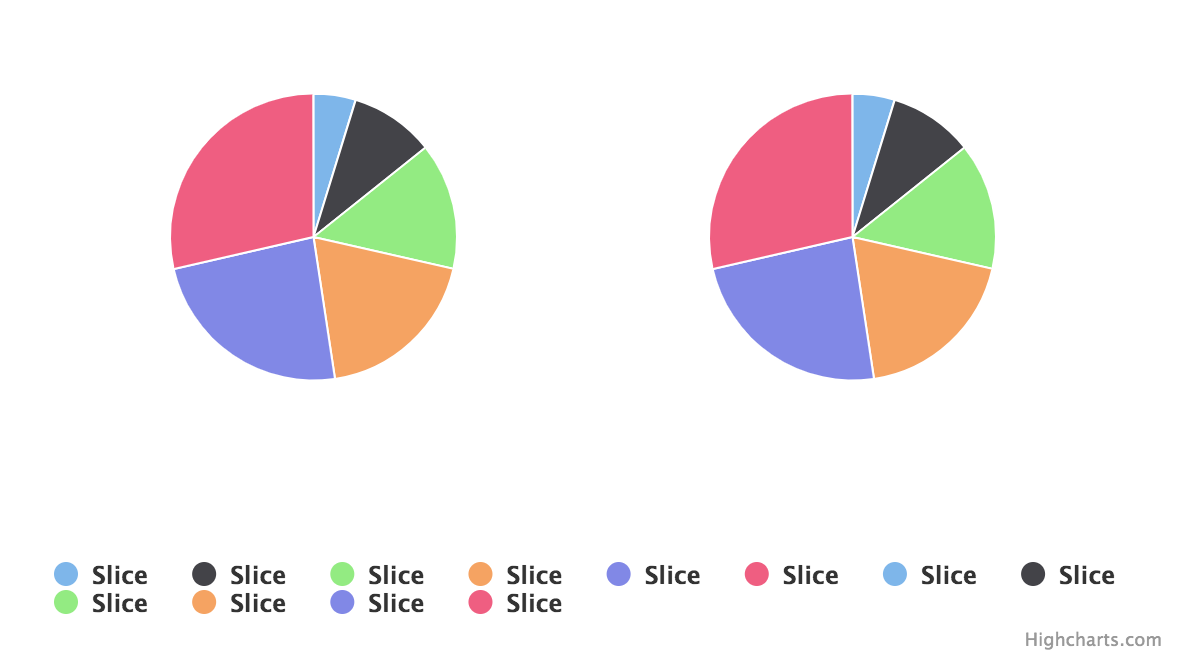
现在,我想对齐每个饼图图例,以便用户可以区分哪个图例属于哪个饼图。
如何解决这个问题?
谢谢
回答 1
Stack Overflow用户
回答已采纳
发布于 2019-10-02 08:22:03
目前,这是不可能的。图表上只能有一个图例。
作为一种解决办法,您可以将它们分成不同的容器:
Highcharts.chart('container1', {
  chart: {
    type: 'pie'
  },
  title: {
    text: ''
  },
  plotOptions: {
    series: {
      dataLabels: {
        enabled: false
      }
    }
  },
  credits: {
    enabled: false
  },
  series: [{
    size: '80%',
    data: [1, 2, 3, 4, 5, 6],
    showInLegend: true,
  }]
});

Highcharts.chart('container2', {
  chart: {
    type: 'pie'
  },
  title: {
    text: ''
  },
  plotOptions: {
    series: {
      dataLabels: {
        enabled: false
      }
    }
  },
  credits: {
    enabled: false
  },
  series: [{
    size: '80%',
    data: [1, 2, 3, 4, 5, 6],
    showInLegend: true,
  }]
});#container1 {
width: 50%;
float: left;
}
#container2 {
width: 50%;
}<script src="https://code.highcharts.com/highcharts.js"></script>
<div id="container1"></div>
<div id="container2"></div>
演示:
- http://jsfiddle.net/BlackLabel/x9pc38za/
页面原文内容由Stack Overflow提供。腾讯云小微IT领域专用引擎提供翻译支持
原文链接:
https://stackoverflow.com/questions/58197124
复制相关文章
相似问题
腾讯云开发者
