
用output.type=“数值”表示ggpmisc::stat_poly_eq中的每个方面的系数
用output.type=“数值”表示ggpmisc::stat_poly_eq中的每个方面的系数
提问于 2019-11-13 15:03:41
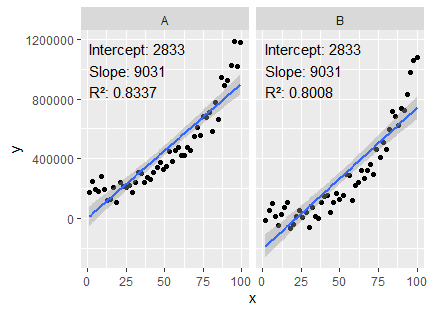
ggpmisc::stat_poly_eq有一个output.type = "numeric"选项,允许得到拟合模型参数的估计。下面是我在facet_wrap中使用它的尝试。每个方面得到不同的R²,但两个方面的系数是相同的。是我做错什么了,还是它是个窃听器?
library(ggpmisc)

set.seed(4321)
x <- 1:100
y <- (x + x^2 + x^3) + rnorm(length(x), mean = 0, sd = mean(x^3) / 4)
my.data <- data.frame(x = x,
                      y = y,
                      group = c("A", "B"))
my.data[my.data$group=="A",]$y <- my.data[my.data$group=="A",]$y + 200000

formula <- y ~ poly(x, 1, raw = TRUE)

myformat <- "Intercept: %s\nSlope: %s\nR²: %s"
ggplot(my.data, aes(x, y)) +
  facet_wrap(~ group) +
  geom_point() +
  geom_smooth(method = "lm", formula = formula) +
  stat_poly_eq(formula = formula, output.type = "numeric",
               mapping = aes(label =
                               sprintf(myformat,
                                       formatC(stat(coef.ls)[[1]][[1, "Estimate"]]),
                                       formatC(stat(coef.ls)[[1]][[2, "Estimate"]]),
                                       formatC(stat(r.squared)))))
编辑
我们得抓住面板号码。奇怪的是,formatC(stat(as.integer(PANEL)))在每个方面返回面板编号:
但是formatC(stat(coef.ls)[[stat(as.integer(PANEL))]][[1, "Estimate"]])不起作用,因为这里是PANEL = c(1,2)。
回答 2
Stack Overflow用户
回答已采纳
发布于 2019-11-13 16:45:19
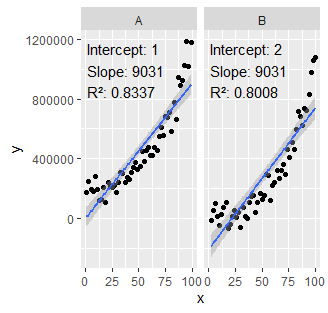
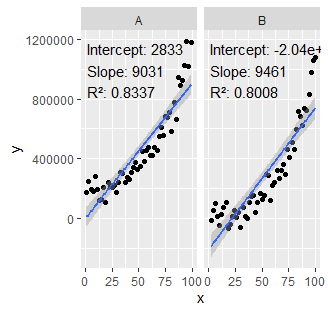
好吧,我想出来了。
ggplot(my.data, aes(x, y)) +
  facet_wrap(~ group) +
  geom_point() +
  geom_smooth(method = "lm", formula = formula) +
  stat_poly_eq(
    formula = formula, output.type = "numeric",
    mapping = aes(label =
                    sprintf(myformat,
                            c(formatC(stat(coef.ls)[[1]][[1, "Estimate"]]),
                              formatC(stat(coef.ls)[[2]][[1, "Estimate"]])),
                            c(formatC(stat(coef.ls)[[1]][[2, "Estimate"]]),
                              formatC(stat(coef.ls)[[2]][[2, "Estimate"]])),
                            formatC(stat(r.squared)))))
Stack Overflow用户
发布于 2019-11-14 18:20:57
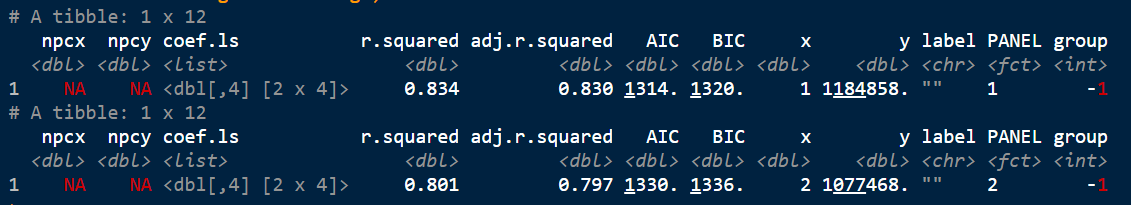
“ggpmisc”的0.3.2版现在已进入CRAN版。本周早些时候提交。在文档中,我现在给出了从包'gginnards‘中使用geom_debug()的一些示例,以查看stats返回的数据框架(可用于任何ggplot或其本身)。以您为例,它的工作方式如下:
library(ggpmisc)
library(gginnards)
set.seed(4321)
x <- 1:100
y <- (x + x^2 + x^3) + rnorm(length(x), mean = 0, sd = mean(x^3) / 4)
my.data <- data.frame(x = x,
y = y,
group = c("A", "B"))
my.data[my.data$group=="A",]$y <- my.data[my.data$group=="A",]$y + 200000
formula <- y ~ poly(x, 1, raw = TRUE)
myformat <- "Intercept: %s\nSlope: %s\nR²: %s"
ggplot(my.data, aes(x, y)) +
facet_wrap(~ group) +
geom_point() +
geom_smooth(method = "lm", formula = formula) +
stat_poly_eq(formula = formula, output.type = "numeric",
aes(label = ""),
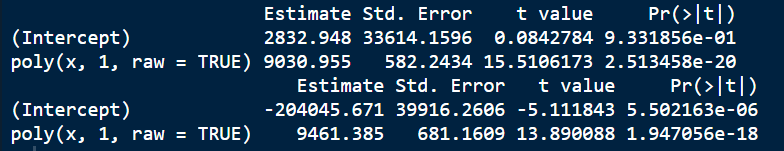
geom = "debug") 它会打印到控制台上,两个小块,每个面板一个:
下面的示例添加到地址注释:
ggplot(my.data, aes(x, y)) +
  facet_wrap(~ group) +
  geom_point() +
  geom_smooth(method = "lm", formula = formula) +
  stat_poly_eq(formula = formula, output.type = "numeric",
               aes(label = ""),
summary.fun = function(x) {x[["coef.ls"]][[1]]})只打印coefs.ls。
我最近根据一项建议添加了"numeric"选项,在这个示例中,我注意到一个bug:不应该需要aes(label = ""),而是需要aes(label = ""),因为label美学的默认映射是错误的。我将在下一个版本中修复这个问题。
页面原文内容由Stack Overflow提供。腾讯云小微IT领域专用引擎提供翻译支持
原文链接:
https://stackoverflow.com/questions/58839940
复制相关文章
相似问题
腾讯云开发者
