
具有共享轴的matplotlib子图
具有共享轴的matplotlib子图
提问于 2019-12-18 16:53:17
我很难理解matplotlib子图是如何允许它们之间共享轴的。我看到了一些例子,但我不能修改一个以适应我的用例。
import numpy as np
import matplotlib.pyplot as plt
import matplotlib as mpl
from matplotlib import cm

d = 4
n1 = 100000
n2 = 100

background_data = np.random.uniform(size=(n1,d))
foreground_data = np.random.uniform(size=(n2,d))

fig = plt.figure()

for i in np.arange(d):
    for j in np.arange(d):
        if i != j:
            ax = fig.add_subplot(d,d,1+i*d+j)
            ax = plt.hist2d(background_data[:, i], background_data[:, j],
                       bins=3*n2,
                       cmap=cm.get_cmap('Greys'),
                       norm=mpl.colors.LogNorm())
            ax = plt.plot(foreground_data[:,i],foreground_data[:,j],'o',markersize=0.2)
问:我如何才能共享所有情节的x和y轴?
Stack Overflow用户
回答已采纳
发布于 2019-12-18 17:10:27
到目前为止,最简单的选择是使用sharex和sharey参数的plt.subplots。
import numpy as np
import matplotlib.pyplot as plt
import matplotlib as mpl
d = 4
n1 = 100000
n2 = 100
background_data = np.random.uniform(size=(n1,d))
foreground_data = np.random.uniform(size=(n2,d))
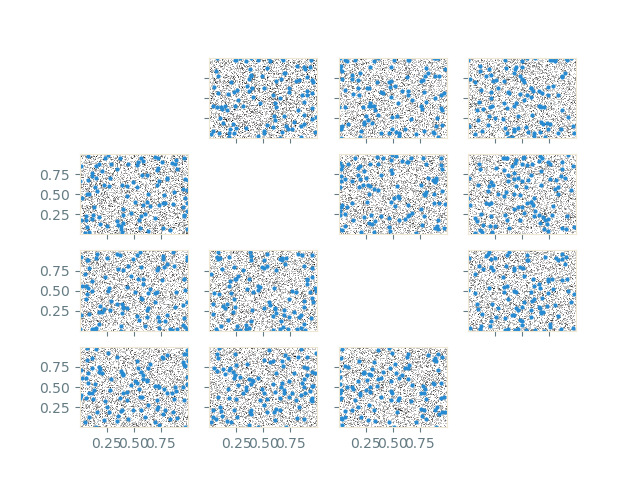
fig, axs = plt.subplots(d,d, sharex=True, sharey=True)
for i in np.arange(d):
for j in np.arange(d):
if i != j:
ax = axs[j,i]
ax.hist2d(background_data[:, i], background_data[:, j],
bins=3*n2,
cmap=plt.get_cmap('Greys'),
norm=mpl.colors.LogNorm())
ax.plot(foreground_data[:,i],foreground_data[:,j],'o',markersize=2)
else:
axs[j,i].remove()
fig.savefig("sharedaxes.png")
plt.show()
页面原文内容由Stack Overflow提供。腾讯云小微IT领域专用引擎提供翻译支持
原文链接:
https://stackoverflow.com/questions/59396766
复制相关文章
相似问题
腾讯云开发者
