
使用matplotlib的三维曲面图使用dataframe列输入数据
使用matplotlib的三维曲面图使用dataframe列输入数据
提问于 2020-02-20 12:15:41
我有一个电子表格文件,我想输入它来使用Python中的Matplotlib创建一个3D曲面图。
我使用了plot_trisurf,它起作用了,但是我需要把轮廓轮廓投影到我可以用曲面函数就像这个例子得到的图形上。
我很难将Z数据安排在一个2D数组中,我可以使用这个数组输入plot_surface方法。我试了很多东西,但似乎都没有用。
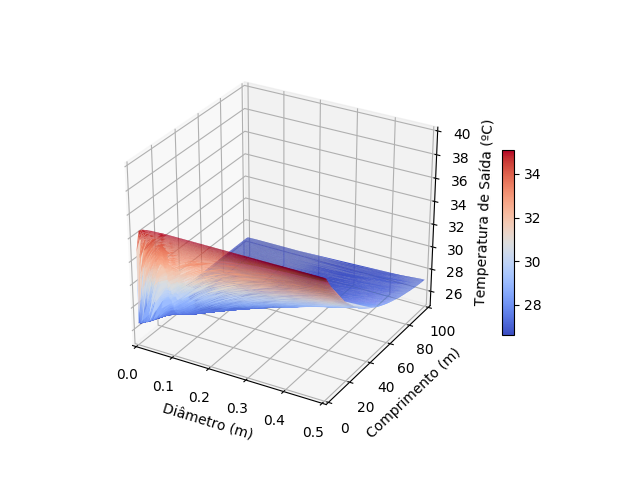
下面是我所做的工作,使用plot_trisurf
import matplotlib
import matplotlib.pyplot as plt
from mpl_toolkits.mplot3d import Axes3D

import numpy as np
import pandas as pd

df=pd.read_excel ("/Users/carolethais/Desktop/Dissertação Carol/Códigos/Resultados/res_02_0.5.xlsx")

fig = plt.figure()
ax = fig.gca(projection='3d')
# I got the graph using trisurf
graf=ax.plot_trisurf(df["Diametro"],df["Comprimento"], df["temp_out"], cmap=matplotlib.cm.coolwarm)

ax.set_xlim(0, 0.5)
ax.set_ylim(0, 100)
ax.set_zlim(25,40)
fig.colorbar(graf, shrink=0.5, aspect=15)
ax.set_xlabel('Diâmetro (m)')
ax.set_ylabel('Comprimento (m)')
ax.set_zlabel('Temperatura de Saída (ºC)')

plt.show()
这是我的df,dataframe的一部分:
       Diametro  Comprimento   temp_out
0      0.334294     0.787092  34.801994
1      0.334294     8.187065  32.465551
2      0.334294    26.155976  29.206090
3      0.334294    43.648591  27.792126
4      0.334294    60.768219  27.163233
...         ...          ...        ...
59995  0.437266    14.113660  31.947302
59996  0.437266    25.208851  30.317583
59997  0.437266    33.823035  29.405461
59998  0.437266    57.724209  27.891616
59999 0.437266 62.455890 27.709298我尝试这种方法使用plot_surface导入的数据,但是我得到的确实是一个图,但它没有工作,这里是这个图使用这种方法的方式:
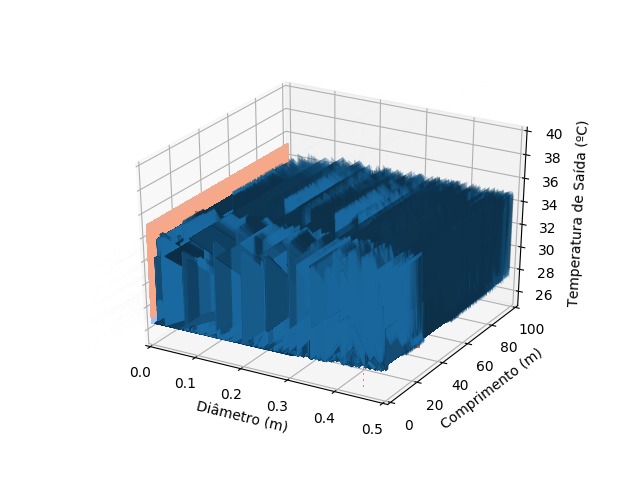
非常感谢
回答 2
Stack Overflow用户
回答已采纳
发布于 2020-02-21 12:25:53
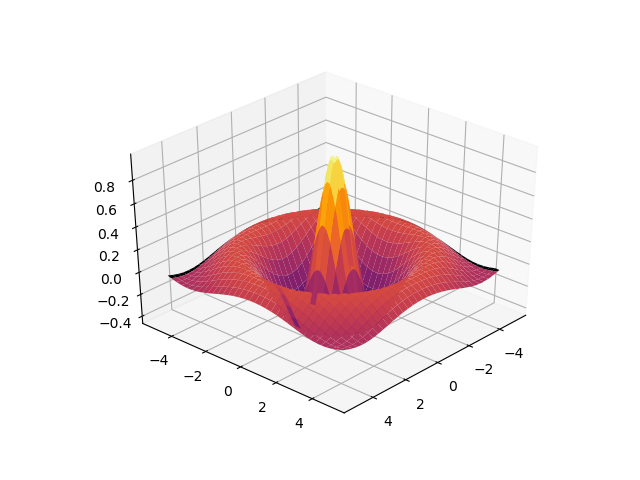
基于重新划分数据的另一种方法不需要在常规网格上指定原始数据[深受这个例子的启发;-]。
import matplotlib.pyplot as plt
import numpy as np
import matplotlib.tri as tri
from mpl_toolkits.mplot3d import Axes3D

np.random.seed(19880808)

# compute the sombrero over a cloud of random points
npts = 10000
x, y = np.random.uniform(-5, 5, npts), np.random.uniform(-5, 5, npts)
z = np.cos(1.5*np.sqrt(x*x + y*y))/(1+0.33*(x*x+y*y))

# prepare the interpolator
triang = tri.Triangulation(x, y)
interpolator = tri.LinearTriInterpolator(triang, z)

# do the interpolation
xi = yi = np.linspace(-5, 5, 101)
Xi, Yi = np.meshgrid(xi, yi)
Zi = interpolator(Xi, Yi)

# plotting
fig = plt.figure()
ax = fig.gca(projection='3d')
norm = plt.Normalize(-1,1)
ax.plot_surface(Xi, Yi, Zi,
                cmap='inferno',
                norm=plt.Normalize(-1,1))
plt.show()
Stack Overflow用户
发布于 2020-02-20 22:39:07
plot_trisurf期望x, y, z为一维数组,而plot_surface则期望X, Y, Z为2D数组或x, y, Z,x, y为一维数组,Z为2D数组。
您的数据由三维数组组成,因此用plot_trisurf绘制它们是即时的,但是您需要使用plot_surface在坐标平面上投影等值线.你需要重塑你的数据。
看起来你有60000个数据点,,在下面我假设你在x方向有一个规则网格300个点,在y上有200个点--但是重要的是规则网格的概念。
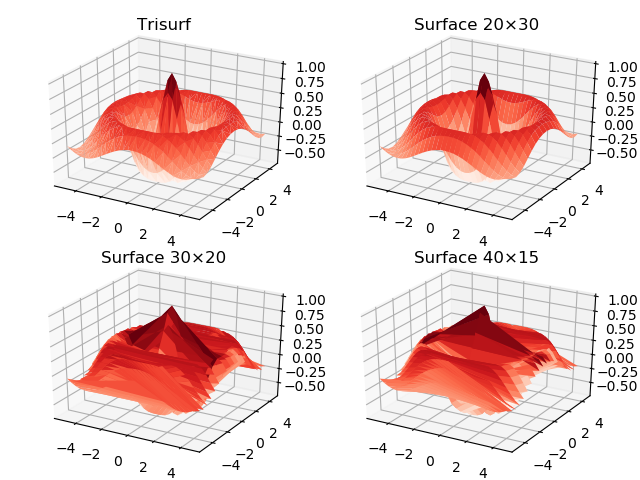
下面的代码显示
- 使用
plot_trisurf(具有更粗的网格),类似于您的代码; - 整形的正确使用及其在
plot_surface中的应用; 注意,整形中的行数对应于y中的点数,列数对应于x中的点数; - 4.不正确地使用整形,生成的子图在某种程度上与您显示的绘图相似,也许您只需要修复行和列的数量。
import matplotlib.pyplot as plt
import numpy as np
from mpl_toolkits.mplot3d import Axes3D

x, y = np.arange(30)/3.-5, np.arange(20)/2.-5
x, y = (arr.flatten() for arr in np.meshgrid(x, y))
z = np.cos(1.5*np.sqrt(x*x + y*y))/(1+0.1*(x*x+y*y))

fig, axes = plt.subplots(2, 2, subplot_kw={"projection" : "3d"})
axes = iter(axes.flatten())

ax = next(axes)
ax.plot_trisurf(x,y,z, cmap='Reds')
ax.set_title('Trisurf')

X, Y, Z = (arr.reshape(20,30) for arr in (x,y,z))
ax = next(axes)
ax.plot_surface(X,Y,Z, cmap='Reds')
ax.set_title('Surface 20×30')

X, Y, Z = (arr.reshape(30,20) for arr in (x,y,z))
ax = next(axes)
ax.plot_surface(X,Y,Z, cmap='Reds')
ax.set_title('Surface 30×20')

X, Y, Z = (arr.reshape(40,15) for arr in (x,y,z))
ax = next(axes)
ax.plot_surface(X,Y,Z, cmap='Reds')
ax.set_title('Surface 40×15')

plt.tight_layout()
plt.show()
页面原文内容由Stack Overflow提供。腾讯云小微IT领域专用引擎提供翻译支持
原文链接:
https://stackoverflow.com/questions/60319715
复制相关文章
相似问题
腾讯云开发者
