
基于R中城市地图的县地块覆盖州轮廓
基于R中城市地图的县地块覆盖州轮廓
提问于 2020-03-25 01:32:37
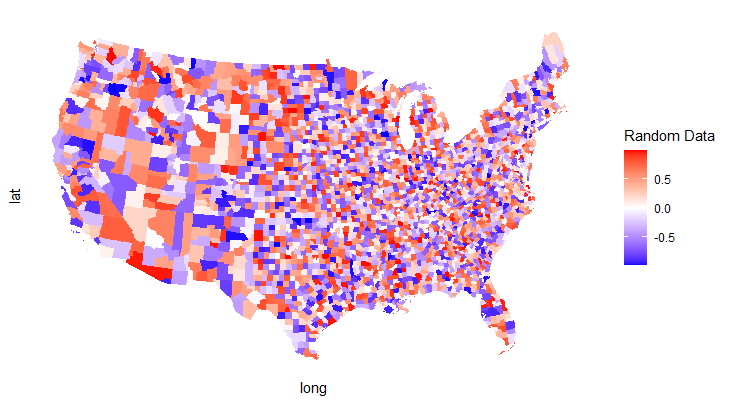
我试图用ubrbanmapr将美国各州的大纲添加到县数据的合唱中。我既可以绘制州大纲,也可以画县合唱,但不能用州大纲来画县合唱。如有任何指导,将不胜感激。
守则:
library(urbnmapr)
library(ggplot2)
library(dplyr)

# Obtain county polygon data
counties_sf <- get_urbn_map(map = "counties", sf = TRUE)

# Assign random values of data to each count
counties_sf$value = runif(length(counties_sf$county_fips), min=-1.0, max=1.0)

# Remove AK and HI - lower 48 only
counties_sf <- counties_sf[!(counties_sf$state_abbv %in% c("HI","AK")),]

# Plot county level  data
counties_sf %>%
ggplot() +
# Overlay State Outlines
geom_polygon(data = urbnmapr::states, mapping = aes(long, lat, group = group),
       fill = NA, color = "black", size = 0.25) +
# Plot county data and fill with value
geom_sf(mapping = aes(fill = value), color = NA) +
# Remove grid lines from plot
coord_sf(datum = NA) +
labs(fill = "Random Data") +
scale_fill_gradient2(low='blue', high='red') +
theme_bw() +
theme(
# Hide panel borders and remove grid lines
panel.border = element_blank())
生成以下图像:
谢谢你的帮忙
jfd118
回答 1
Stack Overflow用户
回答已采纳
发布于 2020-03-25 02:17:21
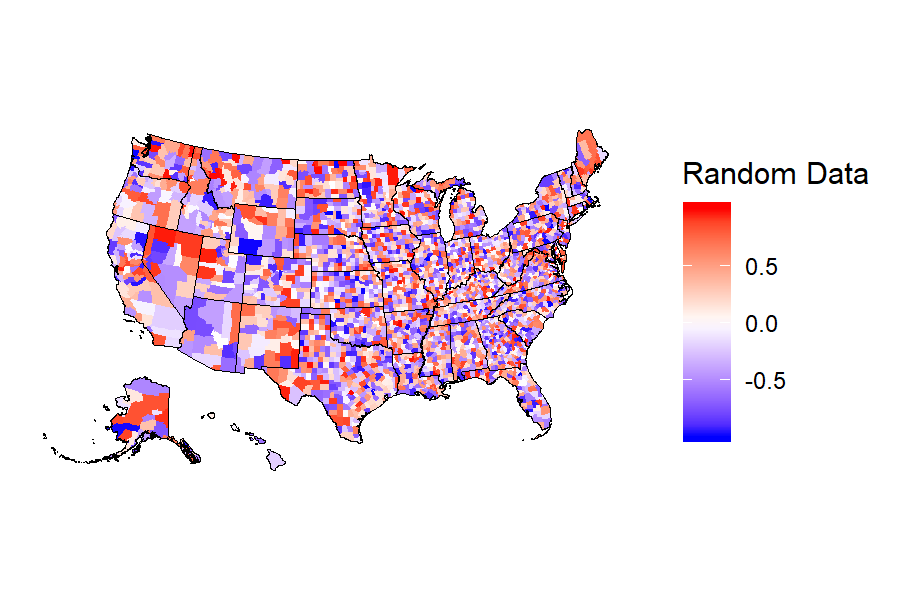
不要使用geom_polygon,添加另一个geom_sf。
#devtools::install_github("UrbanInstitute/urbnmapr")

library(urbnmapr)
library(ggplot2)
library(dplyr)

# Obtain county polygon data
states_sf <- get_urbn_map(map = "states", sf = TRUE)
counties_sf <- get_urbn_map(map = "counties", sf = TRUE)

# Assign random values of data to each count
set.seed(1234)
counties_sf$value = runif(length(counties_sf$county_fips), min=-1.0, max=1.0)

# Plot county level data
  ggplot() +
    # Plot county data and fill with value
    geom_sf(data=counties_sf, mapping = aes(fill = value), color = NA) +

    # Overlay State Outlines
    geom_sf(data = states_sf, fill = NA, color = "black", size = 0.25) +

    # Remove grid lines from plot
    coord_sf(datum = NA) +
    labs(fill = "Random Data") +
    scale_fill_gradient2(low='blue', high='red') +
    theme_bw() +
    theme(
    # Hide panel borders and remove grid lines
    panel.border = element_blank())
页面原文内容由Stack Overflow提供。腾讯云小微IT领域专用引擎提供翻译支持
原文链接:
https://stackoverflow.com/questions/60841840
复制相关文章
相似问题
腾讯云开发者
