
如何使用r中的ggplot对双条进行排序?
如何使用r中的ggplot对双条进行排序?
提问于 2020-05-08 21:51:46
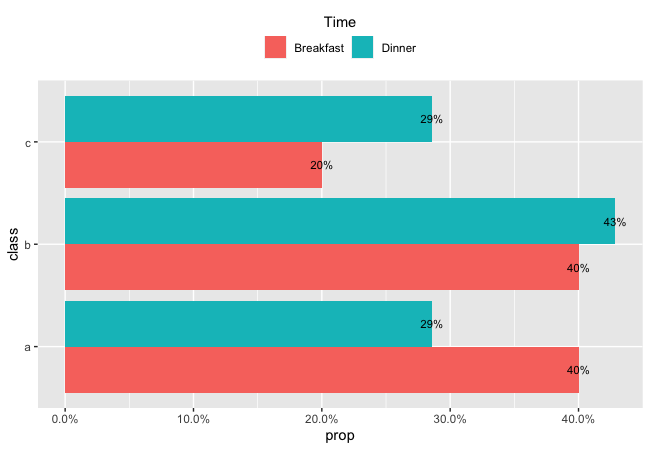
我正在学习r,我在按升序或降序排序双列时有问题,我想在图的顶部设置图例,用两种颜色分别表示一行和两列,例如:
标题Time
盒色Breakfast盒色Dinner
还有这里的情节
这是我的数据
dat <- data.frame(
  time = factor(c("Breakfast","Breakfast","Breakfast","Breakfast","Breakfast","Lunch","Lunch","Lunch","Lunch","Lunch","Lunch","Dinner","Dinner","Dinner","Dinner","Dinner","Dinner","Dinner"), levels=c("Breakfast","Lunch","Dinner")),
  class = c("a","a","b","b","c","a","b","b","c","c","c","a","a","b","b","b","c","c"))
下面是我要做改变的代码:
dat %>%
  filter(time %in% c("Breakfast", "Dinner")) %>%
  droplevels %>%
  count(time, class) %>%
  group_by(time) %>%
  mutate(prop = n/sum(n)) %>%
  ggplot(aes(x = class, y = prop, fill = time, label = scales::percent(prop))) +
  geom_col(position = 'dodge') +
  geom_text(position = position_dodge(width = 0.9), vjust = 0.5, size = 3) +
  scale_y_continuous(labels = scales::percent)+
  coord_flip()
任何帮助都将不胜感激。
回答 1
Stack Overflow用户
回答已采纳
发布于 2020-05-08 22:28:11
要使图例标题高于图例键,需要对主题和指南进行一些额外的调整。
dat %>%
  filter(time %in% c("Breakfast", "Dinner")) %>%
  droplevels %>%
  count(time, class) %>%
  group_by(time) %>%
  mutate(prop = n/sum(n)) %>%
  ggplot(aes(x = class, y = prop, fill = time, label = scales::percent(prop))) +
  geom_col(position = 'dodge') +
  geom_text(position = position_dodge(width = 0.9), vjust = 0.5, size = 3) +
  scale_y_continuous(labels = scales::percent)+
  coord_flip() +
  theme(legend.position="top", legend.direction="vertical", legend.title=element_text(hjust = 0.5))+
  guides(fill = guide_legend(title = "Time", nrow = 1))
页面原文内容由Stack Overflow提供。腾讯云小微IT领域专用引擎提供翻译支持
原文链接:
https://stackoverflow.com/questions/61688685
复制相关文章
相似问题
腾讯云开发者
