
Python :获取更详细的海岸线绘图
Python :获取更详细的海岸线绘图
提问于 2020-07-03 10:08:40
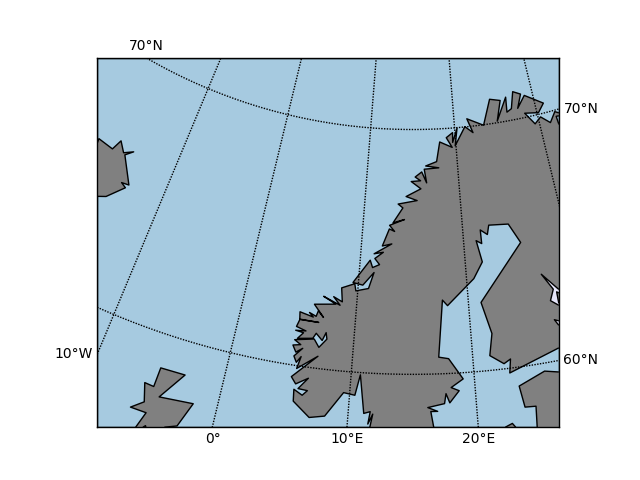
是否有一种方法可以获得比Basemap中的默认海岸线更详细的海岸线?例如,如果我试图展示挪威海岸,默认的地块非常粗糙,有点难看(见图)。有没有办法获得更好的海岸线/控制海岸线分辨率?
代码:
from mpl_toolkits.basemap import Basemap
import matplotlib.pyplot as plt
import numpy as np

# setup Lambert Conformal basemap.
m = Basemap(llcrnrlon=-8.0, llcrnrlat=55.5, urcrnrlon=34.5, urcrnrlat=72.0,
            lat_0="65.0", lon_0=15.0,
            projection="lcc")

# draw coastlines.
m.drawcoastlines()

# draw a boundary around the map, fill the background.
# this background will end up being the ocean color, since
# the continents will be drawn on top.
m.drawmapboundary(fill_color="#A6CAE0")

# fill continents, set lake color.
m.fillcontinents(color='grey',lake_color='lavender')

# draw parallels and meridians.
# label parallels on right and top
# meridians on bottom and left
parallels = np.arange(50.,75.,10.)
# labels = [left,right,top,bottom]
m.drawparallels(parallels,labels=[False,True,True,False])
meridians = np.arange(-10.,40,10.)
m.drawmeridians(meridians,labels=[True,False,False,True])

plt.show()
生产:
解决方案:
非常感谢解决方案@hemmelig :)
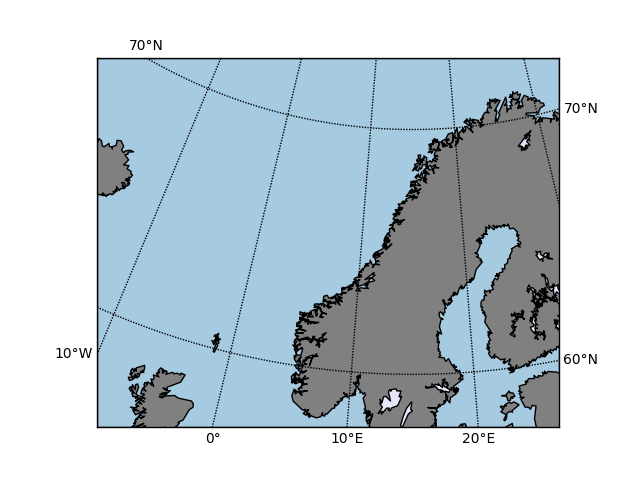
改为:
# setup Lambert Conformal basemap.
m = Basemap(llcrnrlon=-8.0, llcrnrlat=55.5, urcrnrlon=34.5, urcrnrlat=72.0,
            lat_0="65.0", lon_0=15.0,
            projection="lcc",
            resolution="l")
生成更好的地图:
回答 1
Stack Overflow用户
回答已采纳
发布于 2020-07-03 10:31:15
在实例Basemap时使用resolution关键字。
c(原油),l (低),i (中间体),h (高),f (全)或None。如果是None,则不会读取边界数据(并且类方法(如延海岸线)将引发一个If调用)。数据集之间的分辨率下降了大约80%。高分辨率数据集的绘制速度要慢得多。默认c.默认海岸线数据来自GSHHS (http://www.soest.hawaii.edu/wessel/gshhs/gshhs.html)。来自泛型映射工具(http://gmt.soest.hawaii.edu)的状态、国家和河流数据集。(来自医生)
页面原文内容由Stack Overflow提供。腾讯云小微IT领域专用引擎提供翻译支持
原文链接:
https://stackoverflow.com/questions/62713164
复制相关文章
相似问题
腾讯云开发者
