
面上的ggplot2::coord_cartesian
coord_cartesian不允许设置每个面的坐标,而使用其他限制范围的方法往往会在特定的极限上产生直线。由于我们有变宽的y-范围,所以不能对所有方面设置相同的限制;在绘图之前限制数据并不像geom_line/geom_path (https://stackoverflow.com/a/27319786/3358272)那样友好,因为要将数据插值到边缘,然后插入NAs以便拆分行,需要付出更多的努力。(最终,获得所需结果的唯一方法就是准确地做到这一点,这对其他数据来说可能有点麻烦。)
在https://gist.github.com/burchill/d780d3e8663ad15bcbda7869394a348a中提出了一种解决方法,它从
test_data %>%
  ggplot(aes(x=Nsubjects, y = Odds, color=EffectSize)) +
  facet_wrap(DataType ~ ExpType, labeller = label_both, scales="free") +
  geom_line(size=2) +
  geom_ribbon(aes(ymax=Upper, ymin=Lower, fill=EffectSize, color=NULL), alpha=0.2)
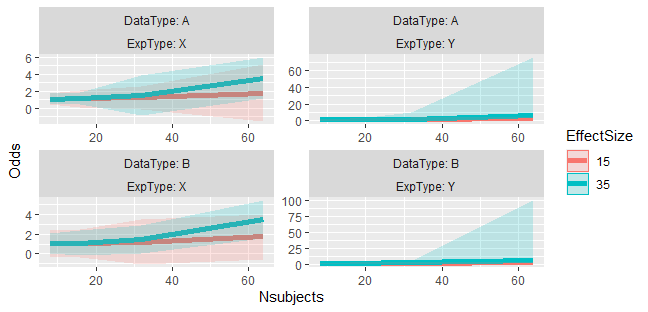
在ggplot2的早期版本中,gist定义了coord_panel_ranges,并能够控制每个方面的坐标。右边的两个面应该缩小到1-6(ish) y轴,这样爆炸的置信区间就会脱离屏幕,使小面主要集中在数据的“正常范围”上。(注:test_data和这个vis不是我的,它是从精神出发的。)虽然我的需求有点相似,但我认为最好保持在gist的数据和代码的范围内。)
不幸的是,对于我来说,这对于ggplot2-3.3.0来说是失败的。最初的错误与最近丢失的ggplot2::scale_range有关,我试图通过修改burchill的代码(使用其他ggplot2:::内部函数)来减轻这些错误:
UniquePanelCoords <- ggplot2::ggproto(
  "UniquePanelCoords", ggplot2::CoordCartesian,

  num_of_panels = 1,
  panel_counter = 1,
  panel_ranges = NULL,

  setup_layout = function(self, layout, params) {
    self$num_of_panels <- length(unique(layout$PANEL))
    self$panel_counter <- 1
    layout
  },

  setup_panel_params =  function(self, scale_x, scale_y, params = list()) {
    if (!is.null(self$panel_ranges) & length(self$panel_ranges) != self$num_of_panels)
      stop("Number of panel ranges does not equal the number supplied")

    train_cartesian <- function(scale, limits, name, given_range = NULL) {
      if (is.null(given_range)) {
        expansion <- ggplot2:::default_expansion(scale, expand = self$expand)
        range <- ggplot2:::expand_limits_scale(scale, expansion,
                                               coord_limits = self$limits[[name]])
      } else {
        range <- given_range
      }

      out <- scale$break_info(range)
      out$arrange <- scale$axis_order()
      names(out) <- paste(name, names(out), sep = ".")
      out
    }

    cur_panel_ranges <- self$panel_ranges[[self$panel_counter]]
    if (self$panel_counter < self$num_of_panels)
      self$panel_counter <- self$panel_counter + 1
    else
      self$panel_counter <- 1

    c(train_cartesian(scale_x, self$limits$x, "x", cur_panel_ranges$x),
      train_cartesian(scale_y, self$limits$y, "y", cur_panel_ranges$y))
  }
)

coord_panel_ranges <- function(panel_ranges, expand = TRUE, default = FALSE, clip = "on") {
  ggplot2::ggproto(NULL, UniquePanelCoords, panel_ranges = panel_ranges,
          expand = expand, default = default, clip = clip)
}
但这仍然是失败的
test_data %>%
  ggplot(aes(x=Nsubjects, y = Odds, color=EffectSize)) +
  facet_wrap(DataType ~ ExpType, labeller = label_both, scales="free") +
  geom_line(size=2) +
  geom_ribbon(aes(ymax=Upper, ymin=Lower, fill=EffectSize, color=NULL), alpha=0.2) +
  coord_panel_ranges(panel_ranges = list(
    list(x=c(8,64), y=c(1,4)), # Panel 1
    list(x=c(8,64), y=c(1,6)), # Panel 2
    list(NULL),                # Panel 3, an empty list falls back on the default values
    list(x=c(8,64), y=c(1,7))  # Panel 4
  ))
# Error in panel_params$x$break_positions_minor() :
# attempt to apply non-function我对扩展ggplot2不是很熟悉,我怀疑我在ggproto中遗漏了什么。下面是proto的返回值:
str(c(train_cartesian(scale_x, self$limits$x, "x", cur_panel_ranges$x),
      train_cartesian(scale_y, self$limits$y, "y", cur_panel_ranges$y)))
# List of 14
#  $ x.range       : num [1:2] 8 64
#  $ x.labels      : chr [1:3] "20" "40" "60"
#  $ x.major       : num [1:3] 0.214 0.571 0.929
#  $ x.minor       : num [1:6] 0.0357 0.2143 0.3929 0.5714 0.75 ...
#  $ x.major_source: num [1:3] 20 40 60
#  $ x.minor_source: num [1:6] 10 20 30 40 50 60
#  $ x.arrange     : chr [1:2] "secondary" "primary"
#  $ y.range       : num [1:2] 1 4
#  $ y.labels      : chr [1:4] "1" "2" "3" "4"
#  $ y.major       : num [1:4] 0 0.333 0.667 1
#  $ y.minor       : num [1:7] 0 0.167 0.333 0.5 0.667 ...
#  $ y.major_source: num [1:4] 1 2 3 4
#  $ y.minor_source: num [1:7] 1 1.5 2 2.5 3 3.5 4
# $ y.arrange : chr [1:2] "primary" "secondary"我需要一个至少包含一个x函数的列表的break_positions_minor元素,还是需要继承一些其他东西来确保panel_params$x$break_positions_minor的存在或者使用合理的缺省值?
数据:
test_data <- structure(list(DataType = structure(c(1L, 1L, 1L, 1L, 1L, 1L,
1L, 1L, 1L, 1L, 1L, 1L, 1L, 1L, 1L, 1L, 2L, 2L, 2L, 2L, 2L, 2L,
2L, 2L, 2L, 2L, 2L, 2L, 2L, 2L, 2L, 2L), .Label = c("A", "B"), class = "factor"),
    ExpType = structure(c(1L, 1L, 1L, 1L, 1L, 1L, 1L, 1L, 2L,
    2L, 2L, 2L, 2L, 2L, 2L, 2L, 1L, 1L, 1L, 1L, 1L, 1L, 1L, 1L,
    2L, 2L, 2L, 2L, 2L, 2L, 2L, 2L), .Label = c("X", "Y"), class = "factor"),
    EffectSize = structure(c(1L, 1L, 1L, 1L, 2L, 2L, 2L, 2L,
    1L, 1L, 1L, 1L, 2L, 2L, 2L, 2L, 1L, 1L, 1L, 1L, 2L, 2L, 2L,
    2L, 1L, 1L, 1L, 1L, 2L, 2L, 2L, 2L), .Label = c("15", "35"
    ), class = "factor"), Nsubjects = c(8, 16, 32, 64, 8, 16,
    32, 64, 8, 16, 32, 64, 8, 16, 32, 64, 8, 16, 32, 64, 8, 16,
    32, 64, 8, 16, 32, 64, 8, 16, 32, 64), Odds = c(1.06248116259846,
    1.09482076720863, 1.23086993413208, 1.76749340505612, 1.06641831731573,
    1.12616954196688, 1.48351814320987, 3.50755080416964, 1.11601399761081,
    1.18352602009495, 1.45705466646283, 2.53384744810515, 1.13847061762186,
    1.24983742407086, 1.97075900741022, 6.01497152563726, 1.02798821372378,
    1.06297006279249, 1.19432835697453, 1.7320754674107, 1.02813271730924,
    1.09355953747203, 1.44830680332583, 3.4732692664923, 1.06295915758305,
    1.12008443626365, 1.3887632112682, 2.46321037334, 1.06722652223114,
    1.1874936754725, 1.89870184372054, 5.943747409114), Upper = c(1.72895843644471,
    2.09878774769559, 2.59771794965346, 5.08513435549015, 1.72999898901071,
    1.8702196882561, 3.85385388850167, 5.92564404180303, 1.99113042576373,
    2.61074135841984, 3.45852331828636, 4.83900142207583, 1.57897154221764,
    1.8957409107653, 10, 75, 2.3763918424135, 2.50181951057562,
    3.45037180395673, 3.99515276392065, 2.04584535265976, 2.39317394040066,
    2.832526733659, 5.38414183471915, 1.40569501856836, 2.6778044191832,
    2.98023068052396, 4.75934650422069, 1.54116883311054, 2.50647989271592,
    3.48517589981551, 100), Lower = c(0.396003888752214, 0.0908537867216577,
    -0.135978081389309, -1.55014754537791, 0.40283764562075,
    0.382119395677663, -0.88681760208193, 1.08945756653624, 0.240897569457892,
    -0.243689318229938, -0.544413985360706, 0.228693474134466,
    0.69796969302609, 0.603933937376415, 0.183548809738402, 3.57236968943798,
    -0.320415414965949, -0.375879384990643, -1.06171509000767,
    -0.531001829099242, 0.010420081958713, -0.206054865456611,
    0.0640868729926525, 1.56239669826544, 0.720223296597732,
    -0.437635546655903, -0.202704257987574, 0.167074242459314,
    0.593284211351745, -0.131492541770921, 0.312227787625573,
    3.76692741957876)), .Names = c("DataType", "ExpType", "EffectSize",
"Nsubjects", "Odds", "Upper", "Lower"), class = c("tbl_df", "tbl",
"data.frame"), row.names = c(NA, -32L))回答 3
Stack Overflow用户
发布于 2020-08-24 07:58:44
我修改了函数train_cartesian,使其与view_scales_from_scale (定义的这里)的输出格式相匹配,这似乎是可行的:
train_cartesian <- function(scale, limits, name, given_range = NULL) {
    if (is.null(given_range)) {
        expansion <- ggplot2:::default_expansion(scale, expand = self$expand)
        range <- ggplot2:::expand_limits_scale(scale, expansion,
                                               coord_limits = self$limits[[name]])
    } else {
        range <- given_range
    }

    out <- list(
        ggplot2:::view_scale_primary(scale, limits, range),
        sec = ggplot2:::view_scale_secondary(scale, limits, range),
        arrange = scale$axis_order(),
        range = range
    )
    names(out) <- c(name, paste0(name, ".", names(out)[-1]))
    out
}p <- test_data %>%
ggplot(aes(x=Nsubjects, y = Odds, color=EffectSize)) +
facet_wrap(DataType ~ ExpType, labeller = label_both, scales="free") +
geom_line(size=2) +
geom_ribbon(aes(ymax=Upper, ymin=Lower, fill=EffectSize, color=NULL), alpha=0.2)
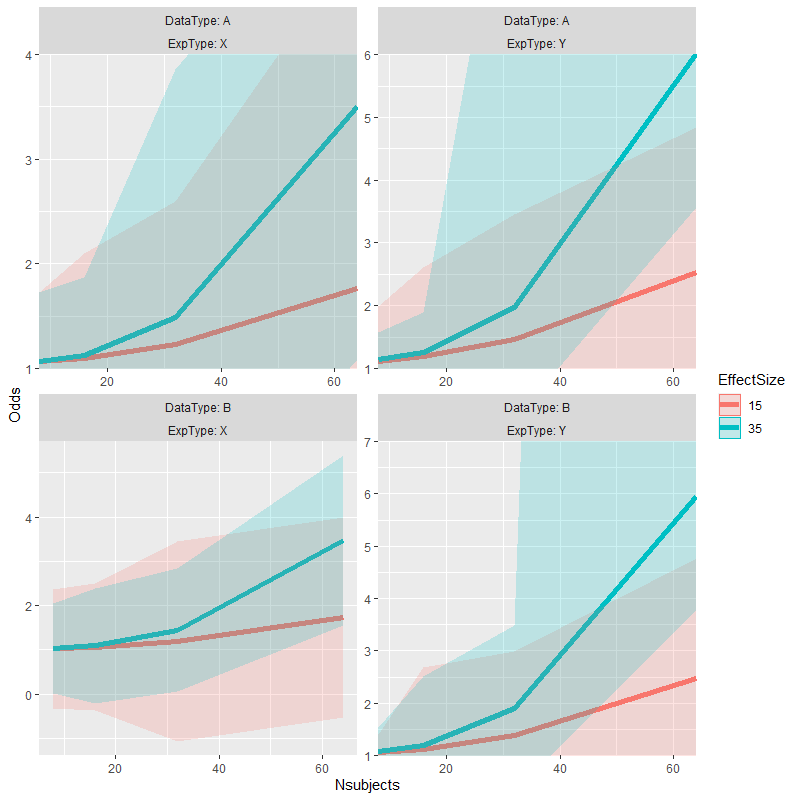
p +
coord_panel_ranges(panel_ranges = list(
list(x=c(8,64), y=c(1,4)), # Panel 1
list(x=c(8,64), y=c(1,6)), # Panel 2
list(NULL), # Panel 3, an empty list falls back on the default values
list(x=c(8,64), y=c(1,7)) # Panel 4
))
原始答案
我以前用欺骗的方式摆脱了相似问题。
# alternate version of plot with data truncated to desired range for each facet
p.alt <- p %+% {test_data %>%
    mutate(facet = as.integer(interaction(DataType, ExpType, lex.order = TRUE))) %>%
    left_join(data.frame(facet = 1:4,
                         ymin = c(1, 1, -Inf, 1),  # change values here to enforce
                         ymax = c(4, 6, Inf, 7)),  # different axis limits
              by = "facet") %>%
    mutate_at(vars(Odds, Upper, Lower), list(~ ifelse(. < ymin, ymin, .))) %>%
    mutate_at(vars(Odds, Upper, Lower), list(~ ifelse(. > ymax, ymax, .))) }

# copy alternate version's panel parameters to original plot & plot the result
p1 <- ggplot_build(p)
p1.alt <- ggplot_build(p.alt)
p1$layout$panel_params <- p1.alt$layout$panel_params
p2 <- ggplot_gtable(p1)
grid::grid.draw(p2)
Stack Overflow用户
发布于 2020-08-24 20:51:59
非常感谢Z.Lin开始修复我的问题,这个答案无疑帮助我克服了错误,并学习了一种更合适的处理ggproto对象的方法。
这个答案更多的是一种灵活的方法来解决每个面板限制在一个分面的地块中的潜在问题。我的第一批代码的主要问题是,它依赖于方面的排序,而在我的另一些(私有)用例中,这些方面并不总是事先就知道(好的,而不是控制的)。正因为如此,我想要一个明确的确定每个面板的限制。
我已经更改了函数名(和args),以表示两点:(1)这似乎是模仿/替换coord_cartesian,(2)我不知道它是否会在没有调整的情况下转换为其他coord_*函数。欢迎在我的要旨评论/补丁。
首先,可以通过以下方式完美地复制Z.Lin的研究结果:
p <- test_data %>%
ggplot(aes(x = Nsubjects, y = Odds, color=EffectSize)) +
facet_wrap(DataType ~ ExpType, labeller = label_both, scales = "free") +
geom_line(size = 2) +
geom_ribbon(aes(ymax = Upper, ymin = Lower, fill = EffectSize, color = NULL), alpha = 0.2)
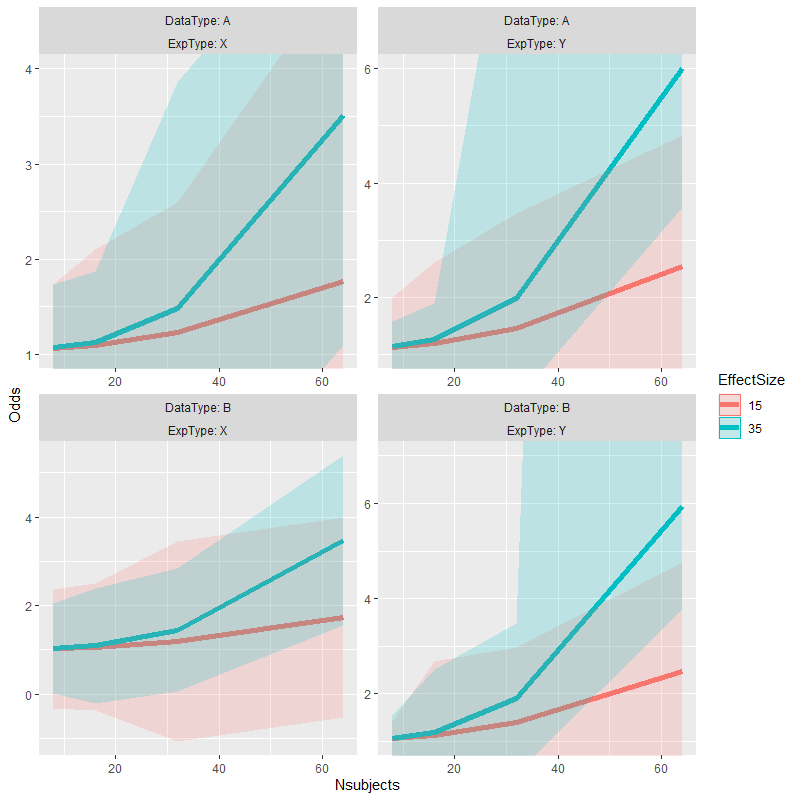
p + coord_cartesian_panels(
panel_limits = tibble::tribble(
~DataType, ~ExpType, ~ymin, ~ymax
, "A" , "X" , 1, 4
, "A" , "Y" , 1, 6
, "B" , "Y" , 1, 7
)
)过去的模糊(最初的代码引入的)面板是列表中的哪个参数。由于它使用data.frame来匹配(通常是merge)与绘图的layout,行的顺序并不重要。
备注:
- 引用的
panel_limits字段是:xmin、xmax、ymin和ymax,在所需的任何方面变量之上; - 特定字段中的
NA(或缺失字段)意味着使用先前定义的限制; - 当所有的面元匹配(在
panel_limits和facet_*定义的布局之间)时,限制设置在各个面板上;这种一对一的映射是关于这个函数的继续假设; - 当某些(但不是所有)变量匹配时,对面板的子集设置限制(例如,在面板的一个轴上,取决于faceting方法);
- 如果没有任何变量匹配且
panel_limits为单行,则不加区分地设置所有面板的限制; panel_limits中与layout中不匹配的行将被静默忽略。
错误:
panel_limits中没有在布局中存在的任何面元变量(即,未在facet_*中指定);或panel_limits中的多行与特定面板匹配。
作为扩展,这也处理了faceting变量的子集,因此如果我们只想通过ExpType限制所有方面,那么
# set the limits on panels based on one faceting variable only
p + coord_cartesian_panels(
  panel_limits = tibble::tribble(
    ~ExpType, ~ymin, ~ymax
  , "X"     ,    NA,     4
  , "Y"     ,     1,     5
  )
) + labs(title = "panel_limits, one variable")

# set the limits on all panels
p + coord_cartesian_panels(
  panel_limits = tibble::tribble(
    ~ymin, ~ymax
  , NA,     5
  )
) + labs(title = "panel_limits, no variables")
(最后一个示例似乎很傻,但是如果面/图是以编程方式构建的,并且不能预先保证存在单个方面,那么这将导致一个合理的默认行为,假设其他方面都是明确的。)
进一步的扩展可能允许facet变量中的NA匹配所有内容,如
# does not work
p + coord_cartesian_panels(
  panel_limits = tibble::tribble(
    ~DataType, ~ExpType, ~ymin, ~ymax
  , "A"      , NA      ,     1,     4
  , NA       , "Y"     ,     1,     6
  )
)这需要merge理解NA的意思是"all/any",而不是字面的NA。现在我不打算扩展merge来处理这个问题,所以我不会让这个函数变得复杂一些。如果有一个合理的merge替代做这种微积分,请让我知道:)
非常感谢..。
UniquePanelCoords <- ggplot2::ggproto(
  "UniquePanelCoords", ggplot2::CoordCartesian,

  num_of_panels = 1,
  panel_counter = 1,
  layout = NULL,

  setup_layout = function(self, layout, params) {
    self$num_of_panels <- length(unique(layout$PANEL))
    self$panel_counter <- 1
    self$layout <- layout # store for later
    layout
  },

  setup_panel_params =  function(self, scale_x, scale_y, params = list()) {
    train_cartesian <- function(scale, limits, name, given_range = c(NA, NA)) {
      if (anyNA(given_range)) {
        expansion <- ggplot2:::default_expansion(scale, expand = self$expand)
        range <- ggplot2:::expand_limits_scale(scale, expansion, coord_limits = limits)
        isna <- is.na(given_range)
        given_range[isna] <- range[isna]
      }
      out <- list(
        ggplot2:::view_scale_primary(scale, limits, given_range),
        sec = ggplot2:::view_scale_secondary(scale, limits, given_range),
        arrange = scale$axis_order(),
        range = given_range
      )
      names(out) <- c(name, paste0(name, ".", names(out)[-1]))
      out
    }

    this_layout <- self$layout[ self$panel_counter,, drop = FALSE ]
    self$panel_counter <-
      if (self$panel_counter < self$num_of_panels) {
        self$panel_counter + 1
      } else 1

    # determine merge column names by removing all "standard" names
    layout_names <- setdiff(names(this_layout),
                            c("PANEL", "ROW", "COL", "SCALE_X", "SCALE_Y"))
    limits_names <- setdiff(names(self$panel_limits),
                            c("xmin", "xmax", "ymin", "ymax"))

    limit_extras <- setdiff(limits_names, layout_names)
    if (length(limit_extras) > 0) {
      stop("facet names in 'panel_limits' not found in 'layout': ",
           paste(sQuote(limit_extras), collapse = ","))
    } else if (length(limits_names) == 0 && NROW(self$panel_limits) == 1) {
      # no panels in 'panel_limits'
      this_panel_limits <- cbind(this_layout, self$panel_limits)
    } else {
      this_panel_limits <- merge(this_layout, self$panel_limits, all.x = TRUE, by = limits_names)
    }

    if (isTRUE(NROW(this_panel_limits) > 1)) {
      stop("multiple matches for current panel in 'panel_limits'")
    }

    # add missing min/max columns, default to "no override" (NA)
    this_panel_limits[, setdiff(c("xmin", "xmax", "ymin", "ymax"),
                                names(this_panel_limits)) ] <- NA

    c(train_cartesian(scale_x, self$limits$x, "x",
                      unlist(this_panel_limits[, c("xmin", "xmax"), drop = TRUE])),
      train_cartesian(scale_y, self$limits$y, "y",
                      unlist(this_panel_limits[, c("ymin", "ymax"), drop = TRUE])))
  }
)

coord_cartesian_panels <- function(panel_limits, expand = TRUE, default = FALSE, clip = "on") {
  ggplot2::ggproto(NULL, UniquePanelCoords,
                   panel_limits = panel_limits,
                   expand = expand, default = default, clip = clip)
}Stack Overflow用户
发布于 2020-08-24 21:59:00
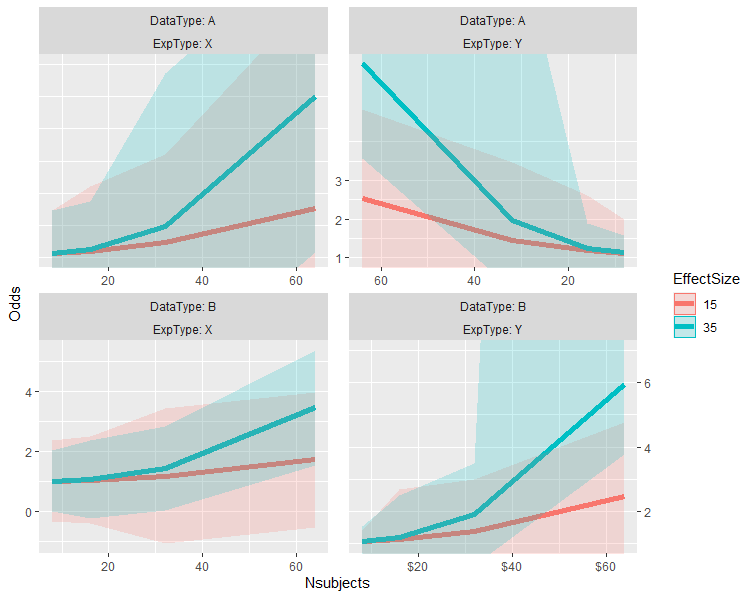
在某种程度上,我遇到了一个类似的问题。其结果是一个稍微冗长,但也更灵活的选择,可以自定义的各个方面的立场比例尺的基础上。由于一些技术上的原因,它在尺度上使用等效的scales::oob_keep()作为oob参数,因此就像坐标决定了极限一样。
library(ggh4x)
library(tidyverse)

p <- test_data %>%
  ggplot(aes(x=Nsubjects, y = Odds, color=EffectSize)) +
  facet_wrap(DataType ~ ExpType, labeller = label_both, scales="free") +
  geom_line(size=2) +
  geom_ribbon(aes(ymax=Upper, ymin=Lower, fill=EffectSize, color=NULL), alpha=0.2) +
  facetted_pos_scales(
    x = list(
      scale_x_continuous(limits = c(8, 64)),
      scale_x_continuous(limits = c(64, 8), trans = "reverse"),
      NULL,
      scale_x_continuous(limits = c(8, 64), labels = scales::dollar_format())
    ),
    y = list(
      scale_y_continuous(limits = c(1, 4), guide = "none"),
      scale_y_continuous(limits = c(1, 6), breaks = 1:3),
      NULL,
      scale_y_continuous(limits = c(1, 7), position = "right")
    )
  )
https://stackoverflow.com/questions/63550588
复制相似问题
腾讯云开发者
