
元组知识图
元组知识图
提问于 2020-11-24 19:29:35
我的目标是创建一个知识图使用csv文件,其中包括,源,边缘和目标。到目前为止,我已经尝试过:
- 它在图像中是不可见的,但我有两个边: 1)用于与
- 相关的。
- I有20个单词的目标元组。
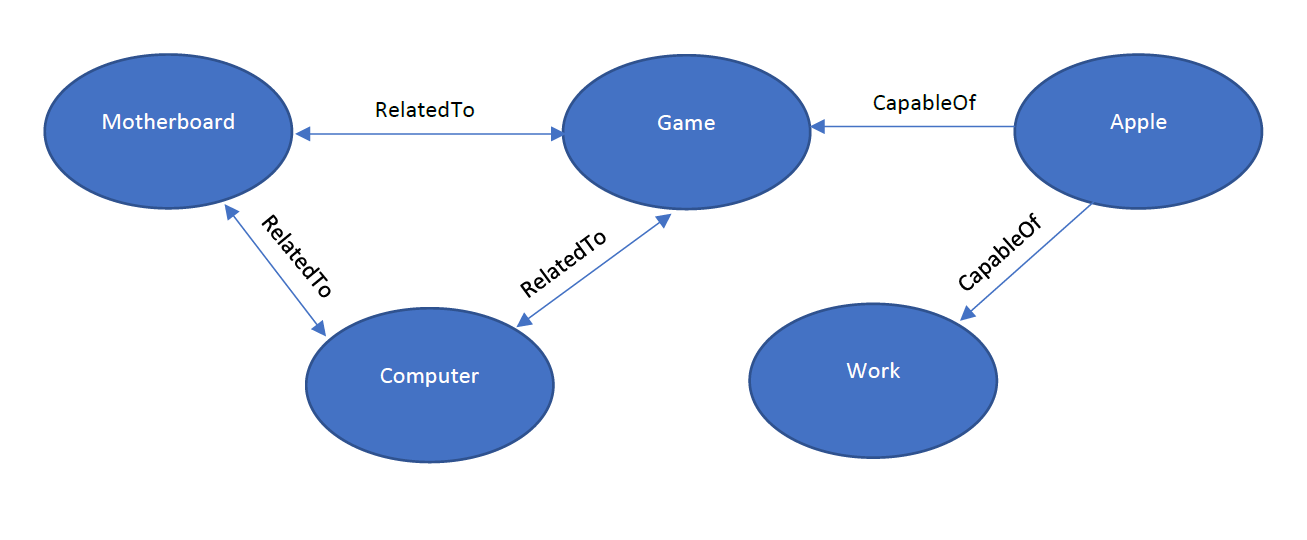
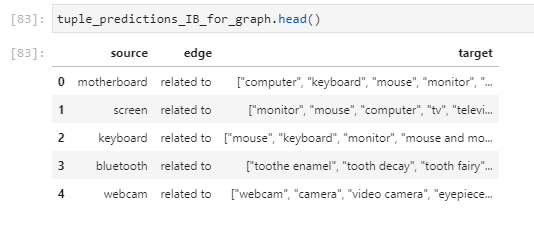
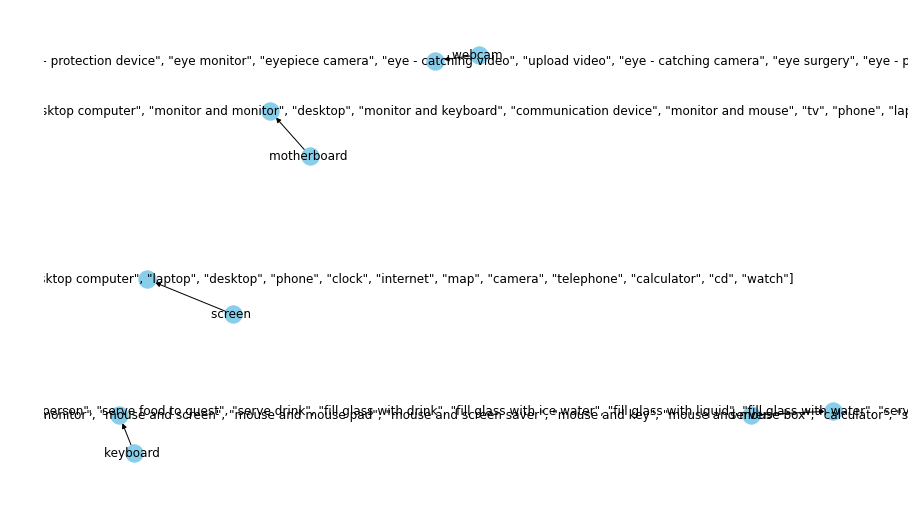
第一张图片是我希望看到的一种格式。第二个图像是我的csv数据文件的头,第三个图像显示了这个代码导致的图形可视化失败。
# create a directed-graph from a dataframe
import networkx as nx

G=nx.from_pandas_edgelist(tuple_predictions_IB_for_graph, "source", "target",
                          edge_attr=True, create_using=nx.MultiDiGraph())
import matplotlib.pyplot as plt


plt.figure(figsize=(12,12))

pos = nx.spring_layout(G)
nx.draw(G, with_labels=True, node_color='skyblue', edge_cmap=plt.cm.Blues, pos = pos)
plt.show()
回答 1
Stack Overflow用户
回答已采纳
发布于 2020-11-24 22:57:45
您应该使用dataframe的explode方法为行中的每个目标创建一个条目,以便每个目标与其适当的源对齐,然后得到所需的节点。
# Make sample data
tuple_predictions_IB_for_graph = pd.DataFrame({'source':['motherboard','screen','keyboard','bluetooth','webcam'],
'edge':['related to']*4+['other_label'],
'target':[['computer','keyboard','mouse','monitor'],
['monitor','mouse','computer','tv'],
['mouse','keyboard','monitor'],
['toothe enamel','tooth decay','tooth fairy'],
['webcam','camera','video camera','eyepiece']]})
# Explode the target column
tuple_df_exploded = tuple_predictions_IB_for_graph.explode(column = 'target')
tuple_df_exploded.head()
# source edge target
# 0 motherboard related to computer
# 0 motherboard related to keyboard
# 0 motherboard related to mouse
# 0 motherboard related to monitor
# 1 screen related to monitor
# Make the graph accepting the 'edge' column as an edge attribute
g = nx.from_pandas_edgelist(tuple_df_exploded,
source='source',target='target',edge_attr='edge',
create_using=nx.MultiDiGraph())
pos = nx.spring_layout(g)
nx.draw_networkx(g,pos)
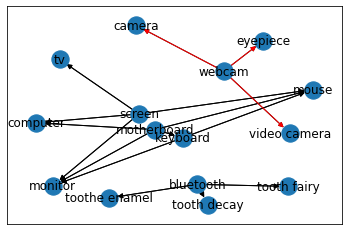
# draw the edges to make them a specific color based on the 'edge' attribute from the df
nx.draw_networkx_edges(g,pos,edgelist=g.edges(),
edge_color=[{'related to':'black',
'other_label':'red'}[edge_label]
for u,v,edge_label in g.edges(data='edge')]);
页面原文内容由Stack Overflow提供。腾讯云小微IT领域专用引擎提供翻译支持
原文链接:
https://stackoverflow.com/questions/64993520
复制相关文章
相似问题
腾讯云开发者
