
等待值更改以进行计算
等待值更改以进行计算
提问于 2021-10-14 14:24:52
我有以下数据:
time <- c(1,2,3,4,5,6,7,8,9,10,11,12)
threshold <- c(1,1,1,0,0,2,2,1,1,2,2,0)
value <- c(5,3,2,4,6,9,1,10,3,5,2,4)
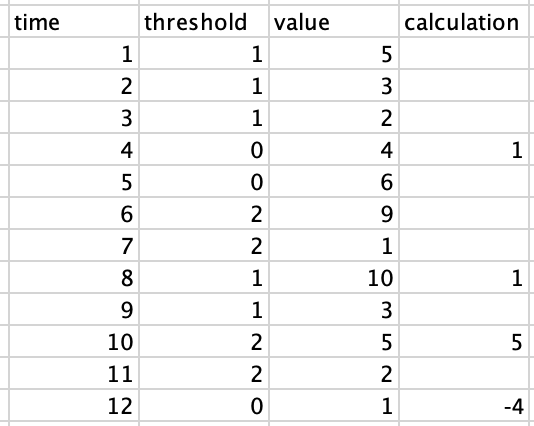
df <- data.frame(time, threshold, value)阈值变量背后的逻辑是,当存在1时:存储第一个值(5),并在阈值变化(4)时减去该数字。在"1“的第一个阈值期间,计算值为5-4= 1,该值应存储在时间为t=4的新列中。
阈值"0“意味着没有计算。
阈值"2“是指正好相反的"1",其中初始值9减去10。
目标是这样一张桌子:
有没有一种方法可以在R中计算这个计算?
回答 1
Stack Overflow用户
回答已采纳
发布于 2021-10-15 01:12:36
如果使用rle函数,则可以将重点放在有阈值更改的行上。然后,将要减去的值对齐,并将阈值转换为控制减法的感受器的因子。
#Select only rows with a threshold change,
# based on https://stackoverflow.com/a/27482738/14027775
compact_threshold <- rle(df$threshold)
row_ids <- cumsum(c(1, compact_threshold$lengths[-length(compact_threshold$lengths)]))

#Transform thresholds to a factor
# if the row is in a threshold change
df$subFactor <- df$threshold
df$subFactor[-row_ids] <- NA
df$subFactor[df$subFactor==0] <- NA
df$subFactor[df$subFactor==2] <- -1

#Align each value with the one
# corresponding to the next threshold change
df$value2 <- NA
df$value2[row_ids] <- c(df$value[row_ids][-1], NA)

df$calculation <- (df$value-df$value2)*df$subFactor
#Shift results to the next threshold
df$calculation[row_ids] <- c(NA, df$calculation[row_ids][-length(row_ids)])

df <- df[,c("time", "threshold", "value", "calculation")]
df
#   time threshold value calculation
#1     1         1     5          NA
#2     2         1     3          NA
#3     3         1     2          NA
#4     4         0     4           1
#5     5         0     6          NA
#6     6         2     9          NA
#7     7         2     1          NA
#8     8         1    10           1
#9     9         1     3          NA
#10   10         2     5           5
#11   11         2     2          NA
#12   12         0     1          -4
原始数据
#Data
time <- c(1,2,3,4,5,6,7,8,9,10,11,12)
threshold <- c(1,1,1,0,0,2,2,1,1,2,2,0)
value <- c(5,3,2,4,6,9,1,10,3,5,2,1)

df <-  data.frame(time, threshold, value)
df
#   time threshold value
#1     1         1     5
#2     2         1     3
#3     3         1     2
#4     4         0     4
#5     5         0     6
#6     6         2     9
#7     7         2     1
#8     8         1    10
#9     9         1     3
#10   10         2     5
#11   11         2     2
#12 12 0 1页面原文内容由Stack Overflow提供。腾讯云小微IT领域专用引擎提供翻译支持
原文链接:
https://stackoverflow.com/questions/69572430
复制相关文章
相似问题
腾讯云开发者
