
如何提高循环重绘的性能?
如何提高循环重绘的性能?
提问于 2021-11-01 04:17:59
我正在读取加速度计传感器数据从一个串口,并试图绘制它的实时使用矩阵库。我编写了下面的代码,它可以做我想做的事情,但是它非常慢。这段代码需要5-6秒来绘制100个样本,但我需要在不到1秒的时间内完成。
import matplotlib.pyplot as plt
import numpy as np

x = np.zeros((1000,))
data = np.zeros((1000,))

plt.ion()
fig, ax = plt.subplots()
ax.set_ylim(-2, 2)
ax.set_xlim(0, 1000)
l, = ax.plot(data)

import serial
ser = serial.Serial('COM3',9600)
index = 0
while True:
    b = ser.readline().decode("utf-8") # reading samples
    temp = b[:-1].split()
    print(temp[0], temp[1])
    x[index] = index
    data[index] = temp[0]
    print(index, temp[0])
    l.set_xdata(x[0:index])
    l.set_ydata(data[0:index])
    index += 1
    fig.canvas.draw()
    fig.canvas.flush_events()
如何提高此代码的性能?
我需要它足够快,以便我可以看到一个过滤(平滑)版本的数据之上的原始数据,从多个传感器实时。
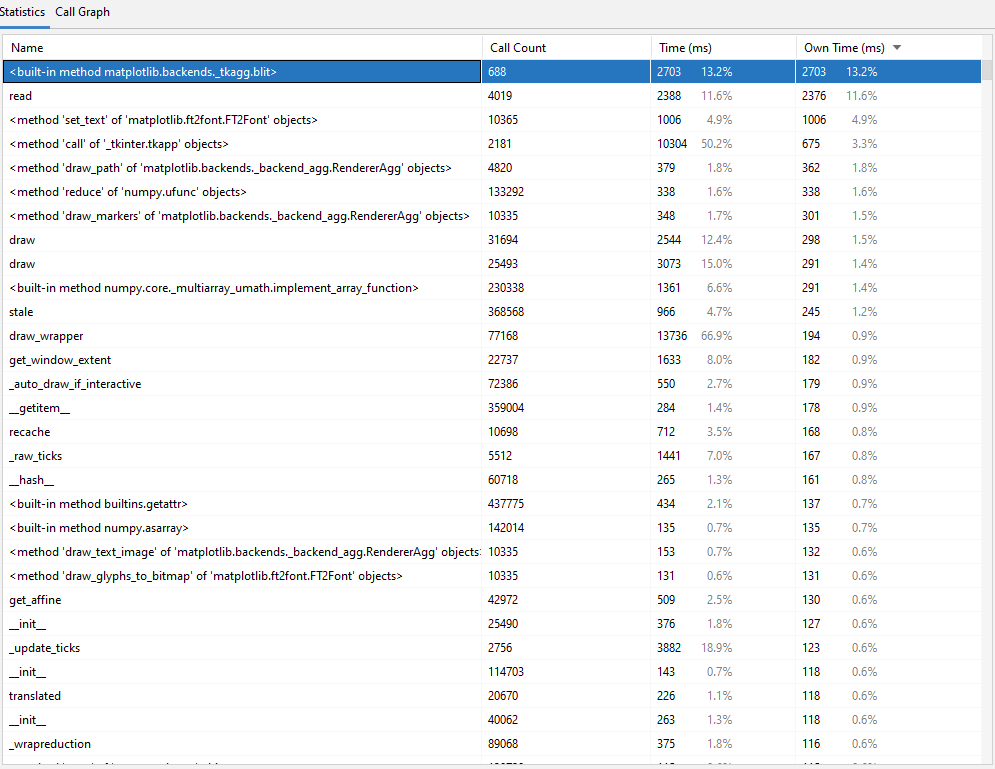
下面是剖析器的屏幕截图,因为程序提前结束了。
回答 2
Stack Overflow用户
回答已采纳
发布于 2021-11-01 16:02:40
我仍然认为您可能不需要单独绘制每个数据点,但是即使只是修改我在评论中链接的闪电式示例,我也得到了155 fps。
import time
import matplotlib.pyplot as plt
import numpy as np

x = np.zeros((1000,))
data = np.zeros((1000,))

fig, ax = plt.subplots()
ax.set_ylim(-2, 2)
ax.set_xlim(0, 1000)

# animated=True tells matplotlib to only draw the artist when we
# explicitly request it
l, = ax.plot(data, animated=True)

# make sure the window is raised, but the script keeps going
plt.show(block=False)

# stop to admire our empty window axes and ensure it is rendered at
# least once.
#
# We need to fully draw the figure at its final size on the screen
# before we continue on so that :
#  a) we have the correctly sized and drawn background to grab
#  b) we have a cached renderer so that ``ax.draw_artist`` works
# so we spin the event loop to let the backend process any pending operations
plt.pause(0.1)

# get copy of entire figure (everything inside fig.bbox) sans animated artist
bg = fig.canvas.copy_from_bbox(fig.bbox)
# draw the animated artist, this uses a cached renderer
ax.draw_artist(l)
# show the result to the screen, this pushes the updated RGBA buffer from the
# renderer to the GUI framework so you can see it
fig.canvas.blit(fig.bbox)

N = 1000
tic = time.time()
index = 0
for ii in range(N):
    # reset the background back in the canvas state, screen unchanged
    fig.canvas.restore_region(bg)

    # update the artist, neither the canvas state nor the screen have changed
    # b = ser.readline().decode("utf-8") # reading samples
    b = f'{2 * np.random.rand()} abcd'
    temp = b[:-1].split()
    x[index] = index
    data[index] = temp[0]
    l.set_xdata(x[0:index])
    l.set_ydata(data[0:index])
    index += 1

    # re-render the artist, updating the canvas state, but not the screen
    ax.draw_artist(l)
    # copy the image to the GUI state, but screen might not be changed yet
    fig.canvas.blit(fig.bbox)
    # flush any pending GUI events, re-painting the screen if needed
    fig.canvas.flush_events()
    # you can put a pause in if you want to slow things down
    # plt.pause(.1)

toc = time.time()
fps = N / (toc - tic)
print(f'fps = {fps}')页面原文内容由Stack Overflow提供。腾讯云小微IT领域专用引擎提供翻译支持
原文链接:
https://stackoverflow.com/questions/69792564
复制相关文章
相似问题
腾讯云开发者
