
4D混沌系统Lyapunov指数
4D混沌系统Lyapunov指数
提问于 2021-11-25 16:43:50
我试图研究四维混沌吸引子李雅普诺夫谱,到目前为止,下面提到的数值对于三维系统是很好的,但是在4D和5D系统中会产生误差。
import matplotlib.pyplot as plt
import numpy as np
from scipy.integrate import odeint

def diff_Lorenz(u):
    x,y,z,w= u
    f = [a*(y-x) , x*z+w, b-x*y, z*y-c*w]
    Df = [[-a,a,0,0], [z,0, x,1], [-y, -x, 0,0],[0,z,y,-c]]
    return np.array(f), np.array(Df)


def LEC_system(u):
    #x,y,z = u[:3]
    U = u[2:18].reshape([4,4])
    L = u[12:15]
    f,Df = diff_Lorenz(u[:4])
    A = U.T.dot(Df.dot(U))
    dL = np.diag(A).copy();
    for i in range(4):
        A[i,i] = 0
        for j in range(i+1,4): A[i,j] = -A[j,i]
    dU = U.dot(A)
    return np.concatenate([f,dU.flatten(),dL])


a=6;b=11;c=5;

u0 = np.ones(4)
U0 = np.identity(4)
L0 = np.zeros(4)
u0 = np.concatenate([u0, U0.flatten(), L0])
t = np.linspace(0,10,301)
u = odeint(lambda u,t:LEC_system(u),u0,t, hmax=0.05)
L = u[5:,12:15].T/t[5:]

# plt.plot(t[5:],L.T)
# plt.show()
p1=L[0,:];p2=L[1,:];p3=L[2,:];p4=L[3,:]
L1 = np.mean(L[0,:]);L2=np.average(L[1,:]);L3=np.average(L[2,:]);L4=np.average(L[3,:])
t1 = np.linspace(0,100,len(p1))
plt.plot(t1,p1);plt.plot(t1,p2);plt.plot(t1,p3);plt.plot(t1,p4)

# plt.show()
print('LES= ',L1,L2,L3,L4)
输出错误为
D:\anaconda3\lib\site-packages\scipy\integrate\odepack.py:247: ODEintWarning: Excess work done on this call (perhaps wrong Dfun type). Run with full_output = 1 to get quantitative information.
  warnings.warn(warning_msg, ODEintWarning)
---------------------------------------------------------------------------
IndexError                                Traceback (most recent call last)
~\AppData\Local\Temp/ipykernel_7008/1971199288.py in <module>
     32 # plt.plot(t[5:],L.T)
     33 # plt.show()
---> 34 p1=L[0,:];p2=L[1,:];p3=L[2,:];p4=L[3,:]
     35 L1=np.mean(L[0,:]);L2=np.average(L[1,:]);L3=np.average(L[2,:]);L4=np.average(L[3,:])
     36 t1 = np.linspace(0,100,len(p1))

IndexError: index 3 is out of bounds for axis 0 with size 3
怎么啦?
预期输出为 L1=.5162,L2=-.0001,L3=-4.9208,L4=-6.5954
回答 1
Stack Overflow用户
回答已采纳
发布于 2021-11-25 19:16:04
在LEC_system(u)中,平面向量u按顺序包含
- 状态向量、
n组件、 - 特征基
U、n x n矩阵 - 累积指数
L、n组件。H 213F 214
使用n=4,这就转化为分解。
def LEC_system(u):
    #x,y,z,w = u[:4]
    U = u[4:20].reshape([4,4])
    L = u[20:24]
    f,Df = diff_Lorenz(u[:4])
    A = U.T.dot(Df.dot(U))
    dL = np.diag(A).copy();
    for i in range(4):
        A[i,i] = 0
        for j in range(i+1,4): A[i,j] = -A[j,i]
    dU = U.dot(A)
    return np.concatenate([f,dU.flatten(),dL])
当然,在积分后的求值中,同样必须使用状态向量的正确段。
L = u[5:,20:24].T/t[5:]然后我就知道情节了
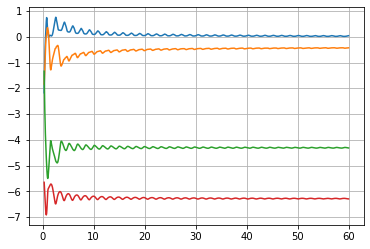
在集成到t=60之后,只使用图的后夸脱
LES= 0.029214865425355396 -0.43816854013111833 -4.309199339754925 -6.28183676249535这仍然不是期望值,因为这似乎是沿所有方向收缩,横贯求解曲线。
页面原文内容由Stack Overflow提供。腾讯云小微IT领域专用引擎提供翻译支持
原文链接:
https://stackoverflow.com/questions/70114662
复制相关文章
相似问题
腾讯云开发者
