
如何在image.plot中编辑x轴上的元素
如何在image.plot中编辑x轴上的元素
提问于 2012-05-26 23:32:26
我为这些数据创建了一个图像图:
sample
         p         p.1         p.2         p.3         p.4
  p    1.0000000  0.24077171 -0.66666667 -0.49009803  0.61237244
  p.1  0.2407717  1.00000000  0.09028939 -0.83444087  0.14744196
  p.2 -0.6666667  0.09028939  1.00000000  0.21004201  0.10206207
  p.3 -0.4900980 -0.83444087  0.21004201  1.00000000 -0.08574929
  p.4  0.6123724  0.14744196  0.10206207 -0.08574929  1.00000000
使用此代码:
image.plot(sample,col=redblue(191), zlim=c(-1,1))我得到了这张照片:
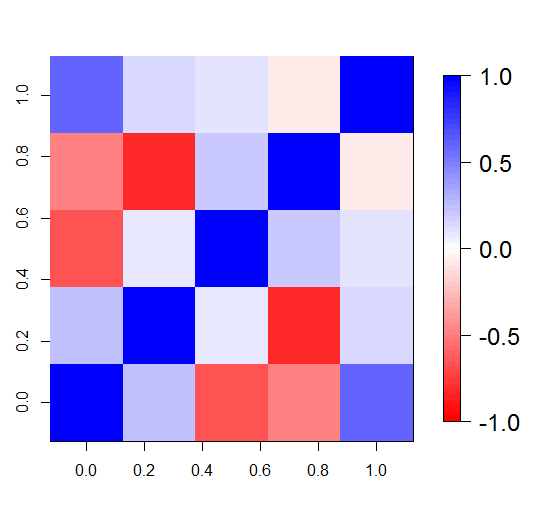
而不是0.0 0.2 0.4。在x和y轴上,我要第1页第2页.我怎么能得到那个?谢谢你的时间和考虑?
我的热图是这样的:
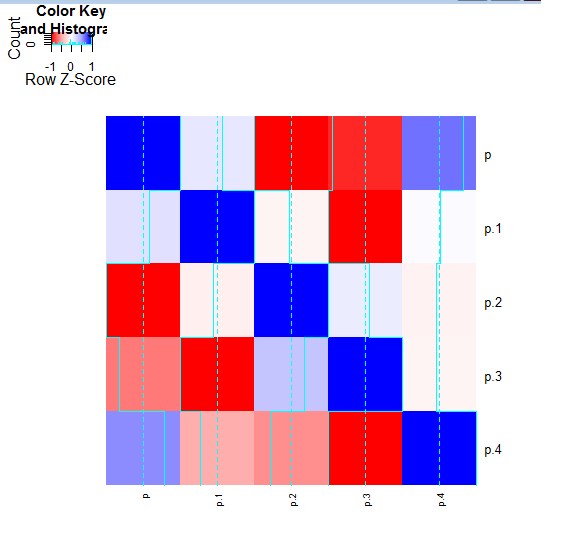
它不对称。你能修一下这个吗?我正在使用以下代码:
shades=c(seq(-1,-0.5,length=64),seq(-0.5,0.5,length=64),seq(0.5,1,length=64))
热图2(样本,树状图=‘none’,symm=TRUE,Rowv=FALSE,Colv=FALSE,key=TRUE,cexCol=0.7,cexRow=1,scale="row",keysize=1,col=redblue(191),breaks=shades)
回答 1
Stack Overflow用户
回答已采纳
发布于 2012-05-27 03:51:45
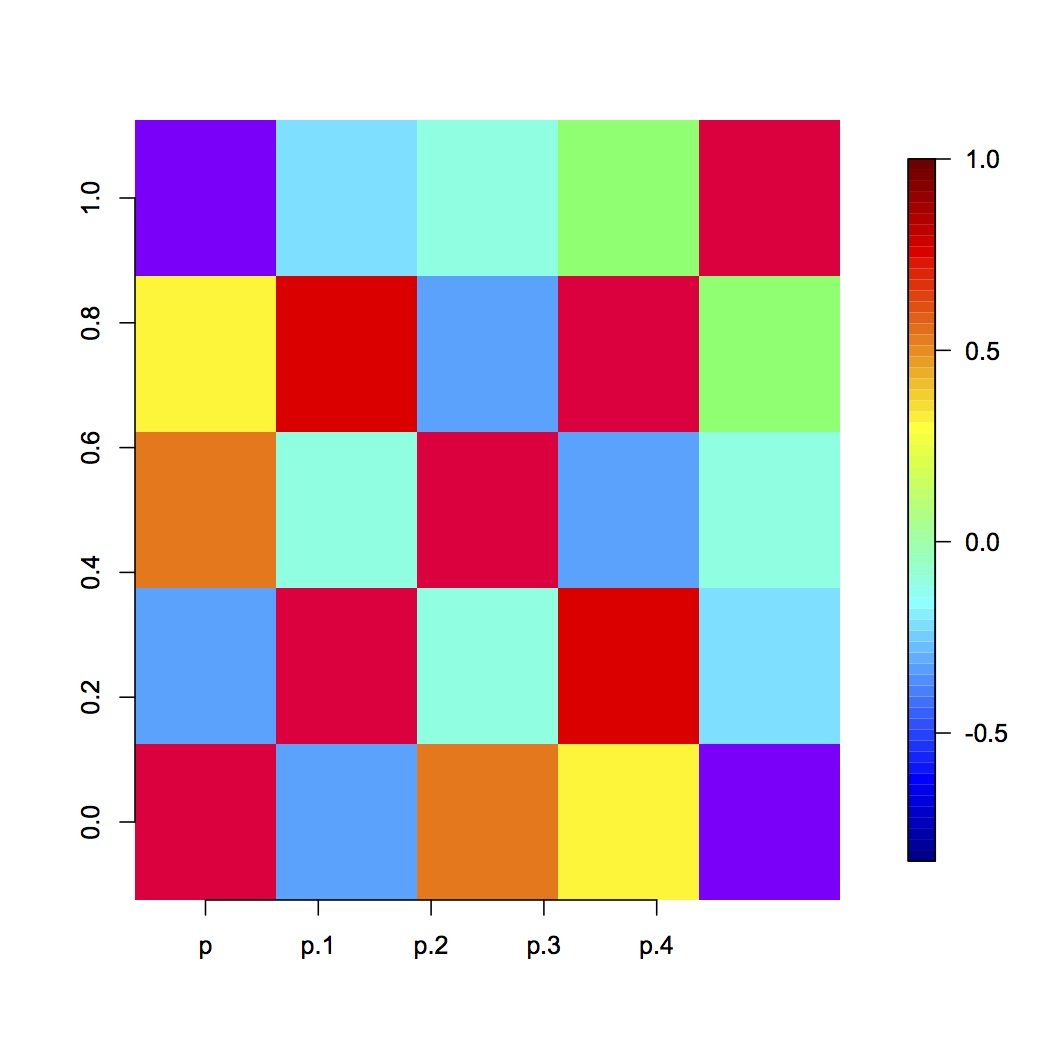
下面是一个更好的解决方案:
 par(mar=c(5,4.5,4,7))
 image(sample, col=rainbow(25), axes=F)  #redblue() doesn't work on my computer.
 axis(2)
 axis(1, at=seq(0,0.8,0.2), labels=rownames(sample))
 image.plot(sample, legend.only=T)
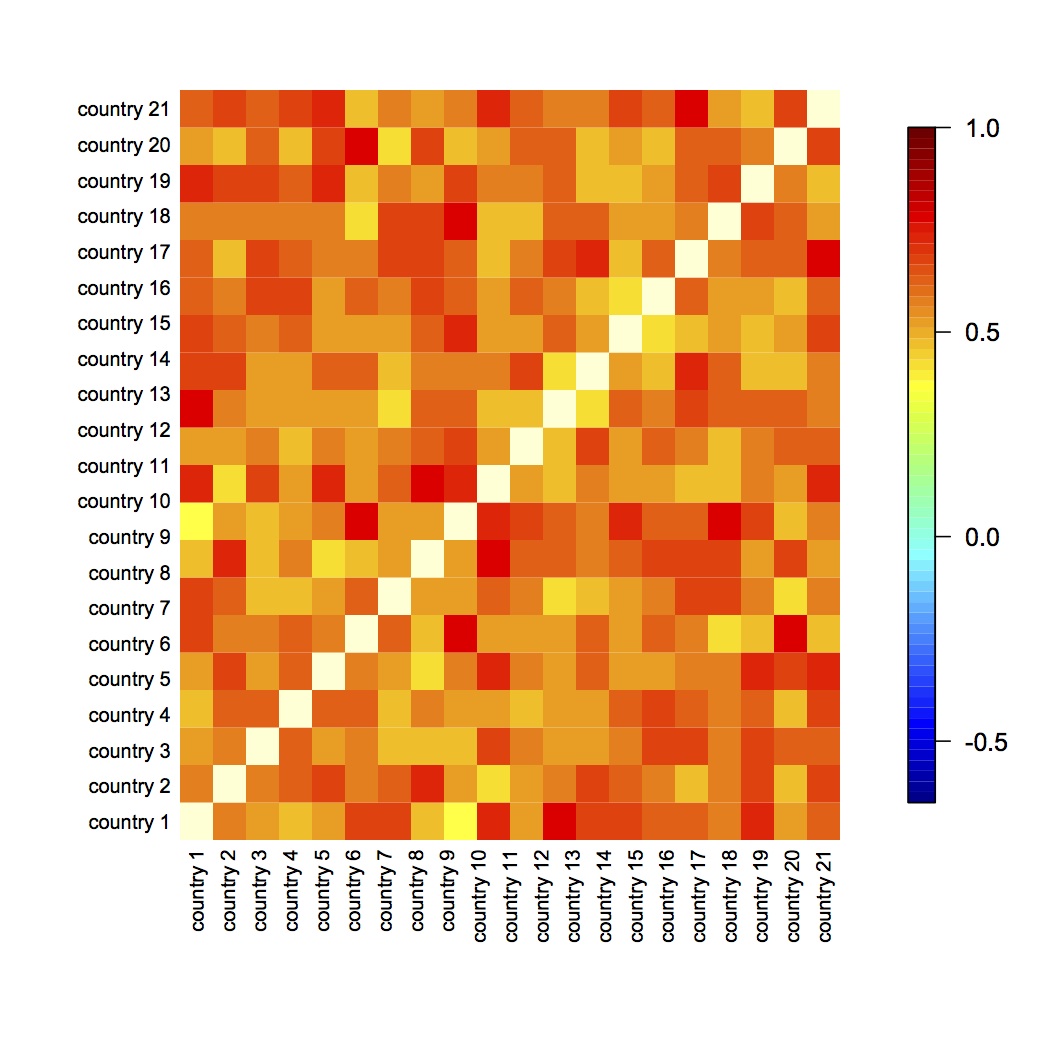
编辑:下面的情节看起来像你要找的东西吗?
 sample = cor(matrix(rnorm(400), nrow=20))
 image(cor(matrix(rnorm(400), nrow=20)), axes=F)
 mtext(text=c(paste("country",1:21)), side=2, line=0.3, at=seq(0,1,0.05), las=1, cex=0.8)
 mtext(text=c(paste("country",1:21)), side=1, line=0.3, at=seq(0,1,0.05), las=2, cex=0.8)
 image.plot(sample, legend.only=T)
页面原文内容由Stack Overflow提供。腾讯云小微IT领域专用引擎提供翻译支持
原文链接:
https://stackoverflow.com/questions/10770550
复制相关文章
相似问题
腾讯云开发者
