
线性距离数据的条件滤波/替换数据(R)
线性距离数据的条件滤波/替换数据(R)
提问于 2012-07-06 13:15:14
以下是我的小例子:.
Mark <- paste ("SN", 1:400, sep = "")
highway <- rep(1:4, each = 100)
set.seed (1234)
MAF <- rnorm (400, 0.3, 0.1)
PPC <- abs (ceiling( rnorm (400, 5, 5)))

set.seed (1234)
Position  <- round(c(cumsum (rnorm (100, 5, 3)),
cumsum (rnorm (100, 10, 3)), cumsum (rnorm (100, 8, 3)),
  cumsum (rnorm (100, 6, 3))), 1)

mydf <- data.frame (Mark, highway, Position, MAF, PPC)
我想过滤的数据,是小于10的PPC在相同的时间大于0.3的MAF。
  # filter PPC < 10 & MAF > 0.3
 filtered <-  mydf[mydf$PPC < 10  & mydf$MAF > 0.3,]
我对可变公路进行分组,每个标记在高速公路上都有位置.例如,前五个标志的1号高速公路:
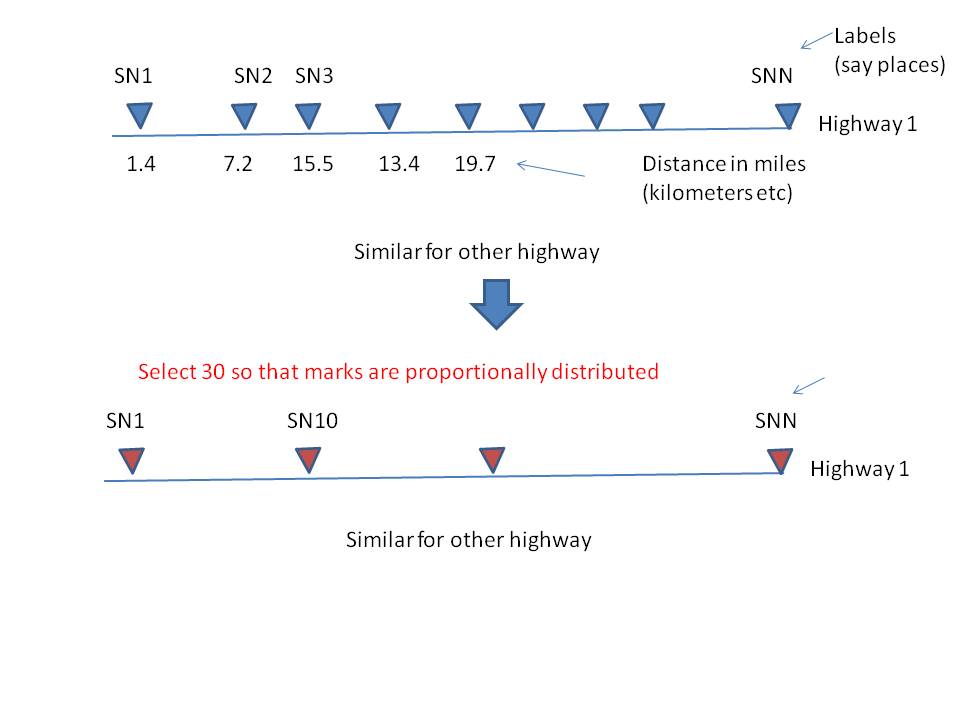
      1.4     7.2      15.5 13.4 19.7
 |-----|.......|.......|.....|.....|
      "SN1" "SN2"   "SN3"  "SN4" "SN5"
现在,我想挑选任何~30个标记,使它们在每条公路上的位置(考虑不同的高速公路长度),它们在每条公路上的分布都很好,而且两条公路之间的最小距离不小于10。
编辑:想法(草图)
我可以考虑一下如何解决这个问题。帮助感激。
编辑:这里我能找到的东西:
# The maximum (length) of each highway is:
out <-  tapply(mydf$Position, mydf$highway, max)
out
     1      2      3      4
 453.0 1012.4  846.4  597.6

min(out)
[1] 453

 #Total length of all highways
totallength <- sum(out)

# Thus average distance at which mark need to be placed:
totallength / 30
[1] 96.98
在1号公路上,理论标记可以是:
 96.98, 96.98+ 96.98, 96.98+96.98+ 96.98, ........till it is less
    than maximum (length )for highway 1.
因此,从理论上讲,我们需要在每隔96.98点选择标记。但公路上的标记可能不会在
注意:选择分数的总结果不一定完全是30 (约30)
回答 1
Stack Overflow用户
回答已采纳
发布于 2012-07-18 08:04:35
因为我们不为任何其他列感到烦恼,所以如果我们使用split来获取位置列表,代码就会更容易一些。
filtered$highway <- factor(filtered$highway)
positions <- with(filtered, split(Position, highway))
根据每条公路的相对长度,可以在每条公路上找到合适的标记数。
highway_lengths <- sapply(positions, max)
total_length <- sum(highway_lengths)
n_marks_per_highway <- round(30 * highway_lengths / total_length)
我们可以使用分位数函数得到目标点,这些目标点在每条公路上都是均匀分布的。
target_mark_points <- mapply(
  function(pos, n)
  {
    quantile(pos, seq.int(0, 1, 1 / (n - 1)))
  },
  positions,
  n_marks_per_highway
)
对于每个目标点,我们在高速公路上找到最近的现有标记。
actual_mark_points <- mapply(
  function(pos, target)
  {
    sapply(target, function(tgt)
    {
      d <- abs(tgt - pos)
      pos[which.min(d)]
    })
  },
  positions,
  target_mark_points
)
为了看它的效果,你可以想象这些痕迹。
is_mark_point <- mapply(
  function(pos, mark)
  {
    pos %in% mark
  },
  positions,
  actual_mark_points
)

filtered$is.mark.point <- unsplit(is_mark_point, filtered$highway)

library(ggplot2)
(p <- ggplot(filtered, aes(Position, highway, colour = is.mark.point)) +
  geom_point()
)页面原文内容由Stack Overflow提供。腾讯云小微IT领域专用引擎提供翻译支持
原文链接:
https://stackoverflow.com/questions/11362915
复制相关文章
相似问题
腾讯云开发者
