
极图插值数据后的matplotlib等高线伪影
极图插值数据后的matplotlib等高线伪影
提问于 2013-01-16 18:00:24
我有一小部分不规则间距的数据,以极格式在圆形区域的各个点采集。我需要做插值,以获得一个定期间隔的网格上的数据,然后我想用等高线图来绘制它们。
我已经完成了插值和绘制结果,但是我必须从极坐标到直角坐标进行插值,当我将数据转换回极坐标时,我在极坐标上得到了工件。
下面的代码演示了我到目前为止所做的工作,并将数据绘制在一个极图和矩形图上:
import numpy as np
import matplotlib.pyplot as plt
from scipy.interpolate import Rbf

# inputs as 1D arrays
r = np.array([0, 1, 1, 1, 1, 2, 2, 2, 2])
theta = np.radians(np.array([0, 90, 180, 270, 0, 90, 180, 270, 0]))
# z = f(theta, r)
z = np.array([8, 7, 6, 4, 5, 2, 2, 2, 2])

# convert to rect
x = r * np.cos(theta)
y = r * np.sin(theta)

# create RBF for smoothing
rbf = Rbf(x, y, z)

# create grid to smooth over
xi, yi = np.mgrid[-2:2:10j, -2:2:10j]
# smooth
zi = rbf(xi, yi)

# convert back to polar
ri = np.sqrt(xi*xi + yi*yi)
ti = np.arctan2(yi, xi)

# polar plot
fig = plt.figure()
ax = plt.subplot(121, polar=True)
cax = ax.contour(ti, ri, zi, 10, linewidths=0.5, colors='k')
cax = ax.contourf(ti, ri, zi, 10, cmap=plt.cm.Spectral)
ax.set_rmax(2)

# rect plot
ax = plt.subplot(122)
cax = ax.contour(xi, yi, zi, 10, linewidths=0.5, colors='k')
cax = ax.contourf(xi, yi, zi, 10, cmap=plt.cm.Spectral)

plt.show()
剩下的问题是:
- 我能修复轮廓线伪像吗?
- 对于含有极坐标的小数据集,Scipy是否提供了一种更合适的插值算法?
回答 1
Stack Overflow用户
回答已采纳
发布于 2013-01-16 23:54:41
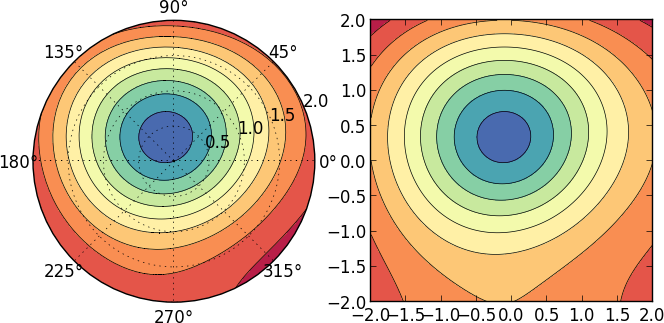
您可能也想阅读this,但就极坐标中的等高线图而言,matplotlib希望在半径和角度中有一个有规律的网格数组,这样您就可以很好地绘制出:
# polar plot
ri, ti = np.mgrid[0:2:100j, 0:2*np.pi:100j]
zi = rbf(ri*np.cos(ti), ri*np.sin(ti))

fig = plt.figure()
ax = plt.subplot(121, polar=True)
cax = ax.contour(ti, ri, zi, 10, linewidths=0.5, colors='k')
cax = ax.contourf(ti, ri, zi, 10, cmap=plt.cm.Spectral)
ax.set_rmax(2)

# rect plot
xi, yi = np.mgrid[-2:2:100j, -2:2:100j]
zi = rbf(xi, yi)

ax = plt.subplot(122, aspect='equal')
cax = ax.contour(xi, yi, zi, 10, linewidths=0.5, colors='k')
cax = ax.contourf(xi, yi, zi, 10, cmap=plt.cm.Spectral)
plt.show()
我对你对Rbf的使用感到有点惊讶。你到底想做什么?你为什么要用那个内插器?
页面原文内容由Stack Overflow提供。腾讯云小微IT领域专用引擎提供翻译支持
原文链接:
https://stackoverflow.com/questions/14364764
复制相关文章
相似问题
腾讯云开发者

Copyright © 2013 - 2026 Tencent Cloud. All Rights Reserved. 腾讯云 版权所有
深圳市腾讯计算机系统有限公司 ICP备案/许可证号:粤B2-20090059 ![]() 粤公网安备44030502008569号
粤公网安备44030502008569号
腾讯云计算(北京)有限责任公司 京ICP证150476号 | 京ICP备11018762号