
计算轨迹中的拐点/枢轴点(路径)
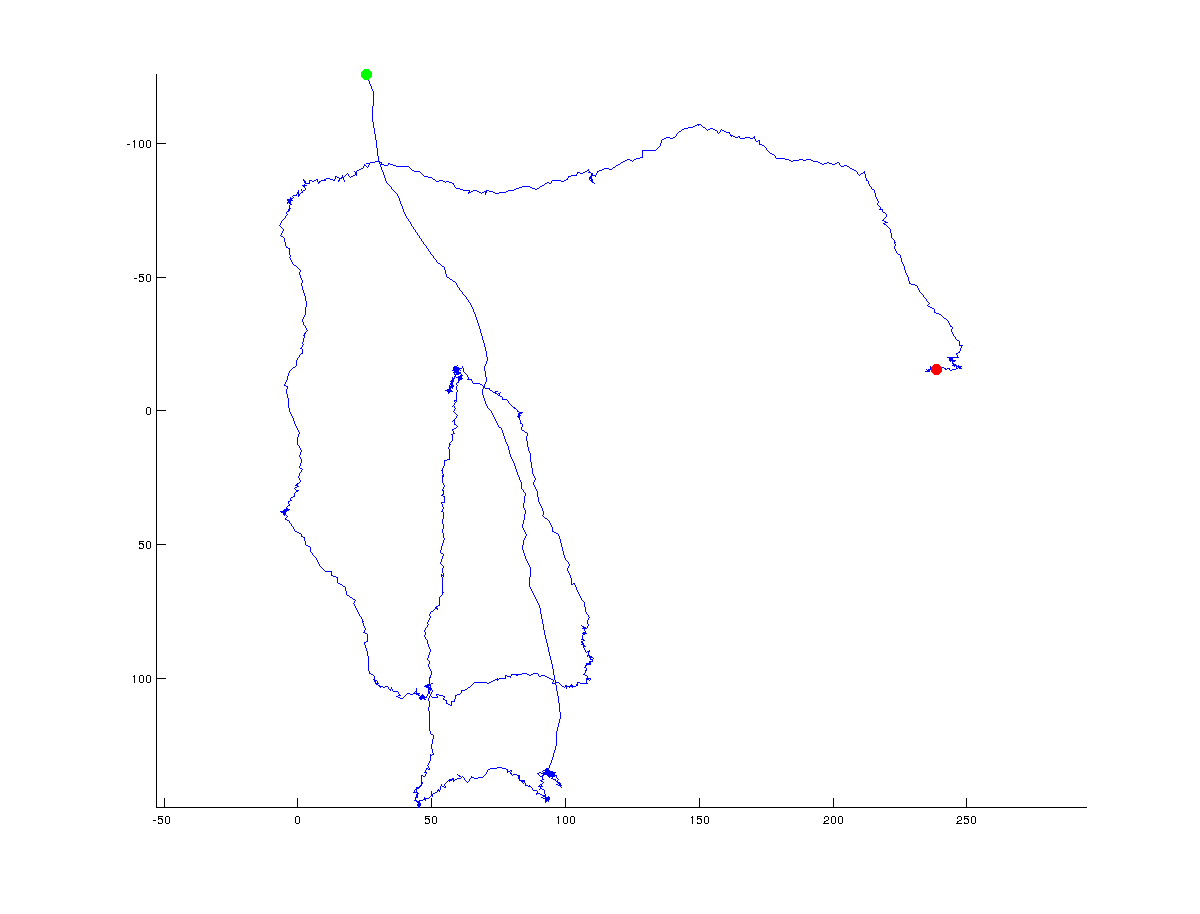
我试着想出一种算法来确定x/y坐标轨迹中的转折点。以下数字说明了我的意思:绿色表示轨迹的起点,红色表示轨迹的最后一点(整个轨迹由1500点组成):
在下面的图中,我手工添加了算法可能返回的(全局)转折点:
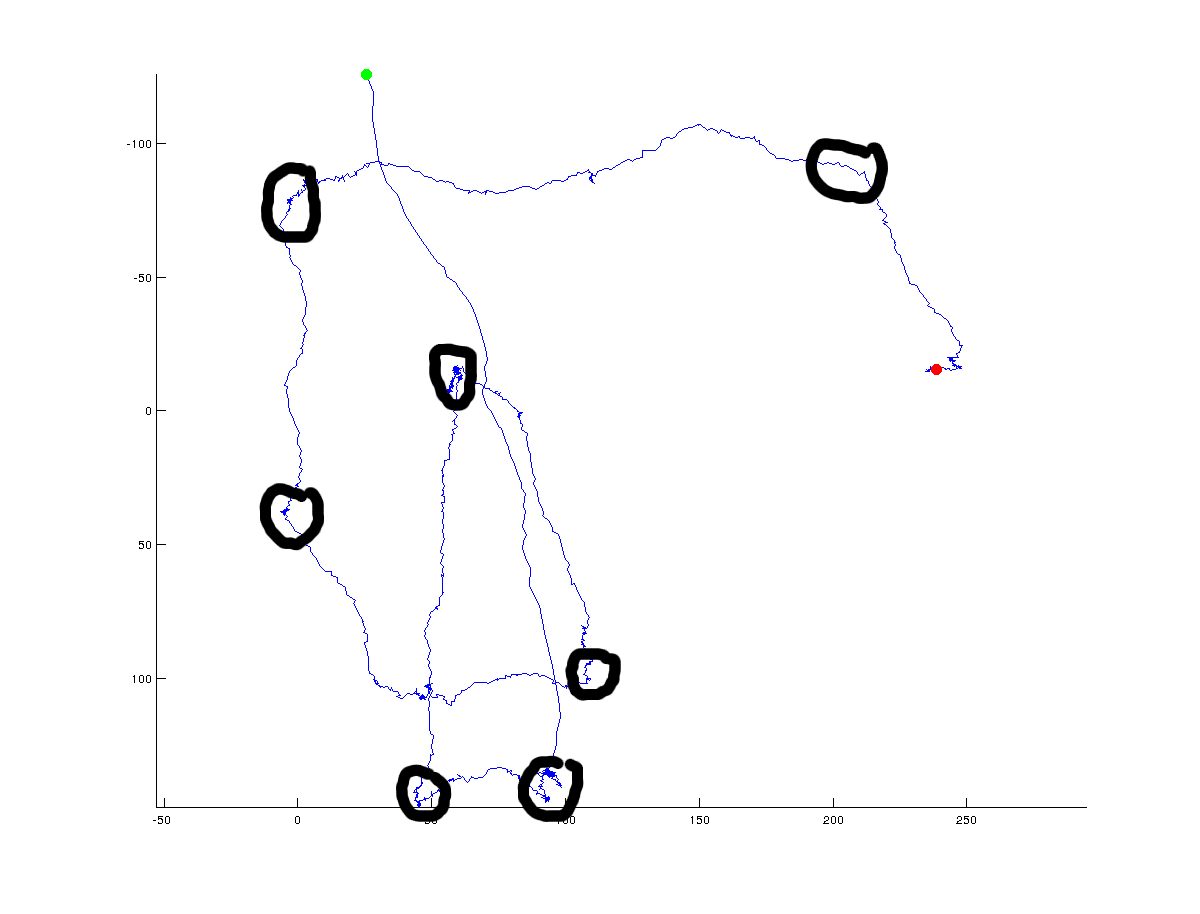
显然,真正的转折点总是有争议的,它将取决于一个人所指定的在点之间的角度。此外,转折点可以在全球范围内定义(我试图用黑圈做的事情),但也可以在高分辨率的局部尺度上定义。我对全局(总体)方向的变化感兴趣,但我希望看到一场关于不同方法的讨论,这些方法可以用来区分全局解决方案和本地解决方案。
到目前为止我尝试过的是:
- 计算后继点之间的距离
- 计算后继点间的角度
- 看看后续点之间的距离/角度如何变化
不幸的是,这并没有给我任何稳健的结果。我可能已经计算了沿着多个点的曲率,但这只是一个想法。我真的很感激任何能在这里帮助我的算法/想法。代码可以是任何编程语言,matlab或python是首选。
编辑这里是原始数据(万一有人想玩它):
- 席文件
- 文本文件 (x坐标第一,y坐标在第二线)
回答 5
Stack Overflow用户
发布于 2013-01-31 21:55:19
您可以使用Ramer-Douglas-Peucker (RDP)算法简化路径。然后你可以计算出在简化路径的每一段方向上的变化。与方向的最大变化相对应的点可称为转折点:
论github可以找到RDP算法的Python实现。
import matplotlib.pyplot as plt
import numpy as np
import os
import rdp

def angle(dir):
    """
    Returns the angles between vectors.

    Parameters:
    dir is a 2D-array of shape (N,M) representing N vectors in M-dimensional space.

    The return value is a 1D-array of values of shape (N-1,), with each value
    between 0 and pi.

    0 implies the vectors point in the same direction
    pi/2 implies the vectors are orthogonal
    pi implies the vectors point in opposite directions
    """
    dir2 = dir[1:]
    dir1 = dir[:-1]
    return np.arccos((dir1*dir2).sum(axis=1)/(
        np.sqrt((dir1**2).sum(axis=1)*(dir2**2).sum(axis=1))))

tolerance = 70
min_angle = np.pi*0.22
filename = os.path.expanduser('~/tmp/bla.data')
points = np.genfromtxt(filename).T
print(len(points))
x, y = points.T

# Use the Ramer-Douglas-Peucker algorithm to simplify the path
# http://en.wikipedia.org/wiki/Ramer-Douglas-Peucker_algorithm
# Python implementation: https://github.com/sebleier/RDP/
simplified = np.array(rdp.rdp(points.tolist(), tolerance))

print(len(simplified))
sx, sy = simplified.T

# compute the direction vectors on the simplified curve
directions = np.diff(simplified, axis=0)
theta = angle(directions)
# Select the index of the points with the greatest theta
# Large theta is associated with greatest change in direction.
idx = np.where(theta>min_angle)[0]+1

fig = plt.figure()
ax =fig.add_subplot(111)

ax.plot(x, y, 'b-', label='original path')
ax.plot(sx, sy, 'g--', label='simplified path')
ax.plot(sx[idx], sy[idx], 'ro', markersize = 10, label='turning points')
ax.invert_yaxis()
plt.legend(loc='best')
plt.show()
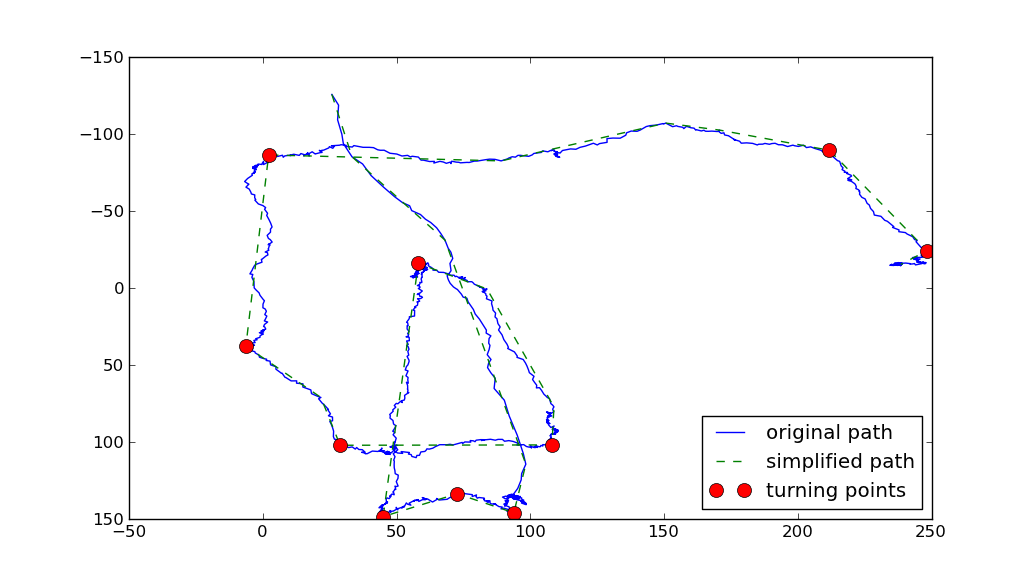
上文使用了两个参数:
- RDP算法采用一个参数
tolerance,表示简化路径与原始路径的最大偏离距离。tolerance越大,简化路径越简单。 - 另一个参数是
min_angle,它定义了什么被认为是转折点。(我取一个拐点作为原始路径上的任意点,其在简化路径上的进入和退出向量之间的角度大于min_angle)。
Stack Overflow用户
发布于 2013-01-31 20:57:28
我将在下面给出numpy/scipy代码,因为我几乎没有Matlab的经验。
如果你的曲线足够光滑,你可以识别出你的转折点是那些最高的曲率。以点索引数作为曲线参数和一个中心差分格式,您可以使用以下代码计算曲率
import numpy as np
import matplotlib.pyplot as plt
import scipy.ndimage

def first_derivative(x) :
    return x[2:] - x[0:-2]

def second_derivative(x) :
    return x[2:] - 2 * x[1:-1] + x[:-2]

def curvature(x, y) :
    x_1 = first_derivative(x)
    x_2 = second_derivative(x)
    y_1 = first_derivative(y)
    y_2 = second_derivative(y)
    return np.abs(x_1 * y_2 - y_1 * x_2) / np.sqrt((x_1**2 + y_1**2)**3)
你可能会想要先平滑你的曲线,然后计算曲率,然后确定最高曲率点。以下功能就是这样做的:
def plot_turning_points(x, y, turning_points=10, smoothing_radius=3,
                        cluster_radius=10) :
    if smoothing_radius :
        weights = np.ones(2 * smoothing_radius + 1)
        new_x = scipy.ndimage.convolve1d(x, weights, mode='constant', cval=0.0)
        new_x = new_x[smoothing_radius:-smoothing_radius] / np.sum(weights)
        new_y = scipy.ndimage.convolve1d(y, weights, mode='constant', cval=0.0)
        new_y = new_y[smoothing_radius:-smoothing_radius] / np.sum(weights)
    else :
        new_x, new_y = x, y
    k = curvature(new_x, new_y)
    turn_point_idx = np.argsort(k)[::-1]
    t_points = []
    while len(t_points) < turning_points and len(turn_point_idx) > 0:
        t_points += [turn_point_idx[0]]
        idx = np.abs(turn_point_idx - turn_point_idx[0]) > cluster_radius
        turn_point_idx = turn_point_idx[idx]
    t_points = np.array(t_points)
    t_points += smoothing_radius + 1
    plt.plot(x,y, 'k-')
    plt.plot(new_x, new_y, 'r-')
    plt.plot(x[t_points], y[t_points], 'o')
    plt.show()
有些解释是恰当的:
turning_points是要识别的点数。smoothing_radius是在计算曲率之前应用于数据的平滑卷积的半径。cluster_radius是指从高曲率点选择为拐点的距离,其中不应考虑其他点作为候选点。
你可能得稍微玩一下参数,但我得到了这样的东西:
>>> x, y = np.genfromtxt('bla.data')
>>> plot_turning_points(x, y, turning_points=20, smoothing_radius=15,
...                     cluster_radius=75)
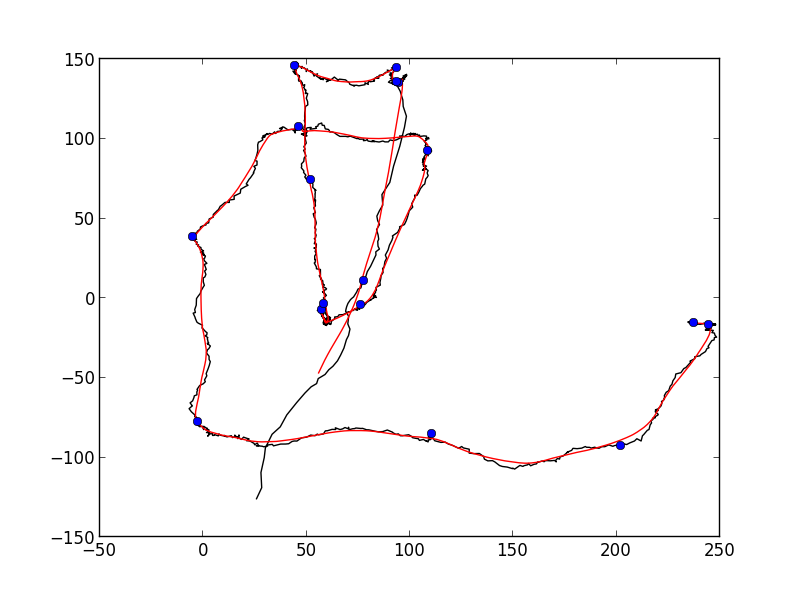
可能还不足以进行完全自动化的检测,但它非常接近您想要的结果。
Stack Overflow用户
发布于 2013-01-31 20:20:44
一个非常有趣的问题。这是我的解决方案,它允许可变分辨率。虽然,微调可能并不简单,因为它主要是为了缩小范围
每一个k点,计算凸包并将其存储为一个集合。通过最多k点,移除凸壳中不存在的任何点,这样点就不会丢失它们原来的顺序。
这里的目的是,凸包将作为一个过滤器,删除所有“不重要的点”只留下极值点。当然,如果k值太高,你最终会得到一些离实际凸包太近的东西,而不是你真正想要的。
这应该从一个小k开始,至少4,然后增加它,直到你得到你想要的。你可能也应该只包括中间点的每3个点的角度是低于一定的量,d。这将确保所有的转弯是至少d度(不是在下面的代码实现)。然而,这可能应该是渐进的,以避免信息的丢失,就像增加k值一样。另一个可能的改进是实际重新运行被移除的点,并且只删除两个凸包中不存在的点,尽管这需要至少8的较高的最小k值。
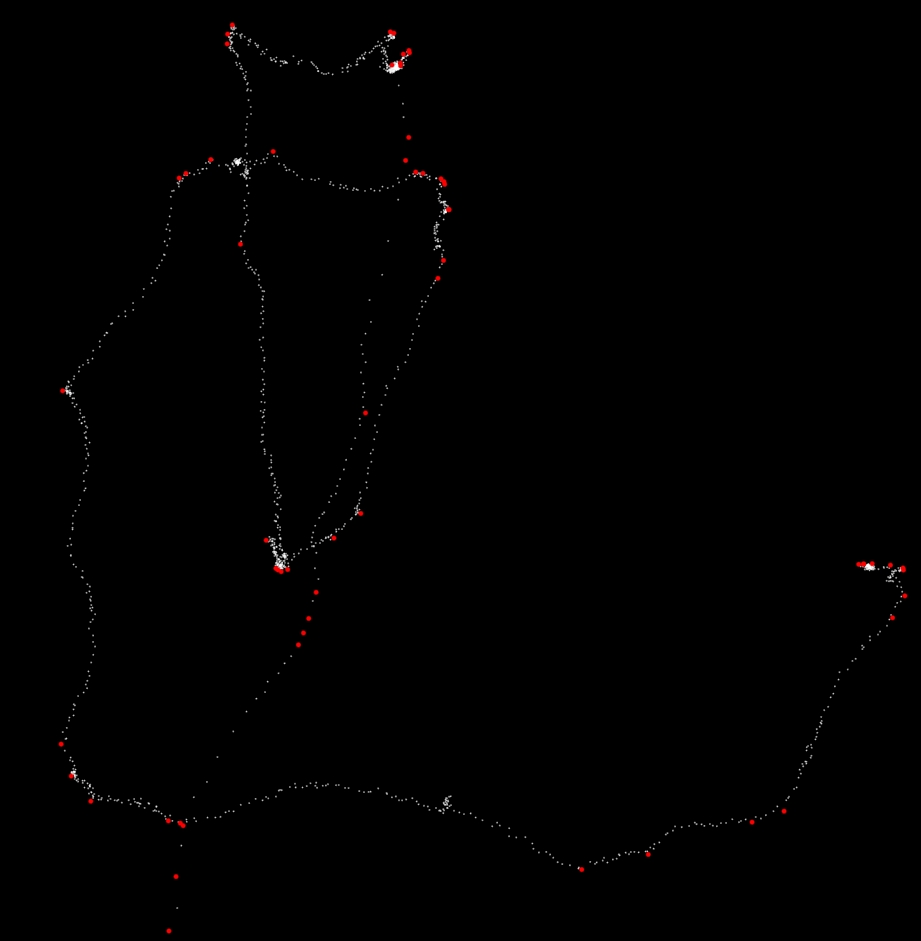
下面的代码似乎运行得很好,但是仍然可以使用改进来提高效率和消除噪音。在确定何时停止时,这也是相当不优雅的,因此代码实际上只能从k=4到k=14运行(按原样运行)。
def convex_filter(points,k):
    new_points = []
    for pts in (points[i:i + k] for i in xrange(0, len(points), k)):
        hull = set(convex_hull(pts))
        for point in pts:
            if point in hull:
                new_points.append(point)
    return new_points

# How the points are obtained is a minor point, but they need to be in the right order.
x_coords = [float(x) for x in x.split()]
y_coords = [float(y) for y in y.split()]
points = zip(x_coords,y_coords)

k = 10

prev_length = 0
new_points = points

# Filter using the convex hull until no more points are removed
while len(new_points) != prev_length:
    prev_length = len(new_points)
    new_points = convex_filter(new_points,k)
下面是上面的k=14代码的屏幕截图,61个红色的点是滤镜后留下的。
https://stackoverflow.com/questions/14631776
复制相似问题
腾讯云开发者

Copyright © 2013 - 2026 Tencent Cloud. All Rights Reserved. 腾讯云 版权所有
深圳市腾讯计算机系统有限公司 ICP备案/许可证号:粤B2-20090059 ![]() 粤公网安备44030502008569号
粤公网安备44030502008569号
腾讯云计算(北京)有限责任公司 京ICP证150476号 | 京ICP备11018762号