
在Matlab中,我如何改变箭头风格的箭图?
我想改变箭头的默认风格在箭图。我怎么才能改变呢?
回答 5
Stack Overflow用户
发布于 2013-09-13 01:27:52
Matlab版本的> R2014b
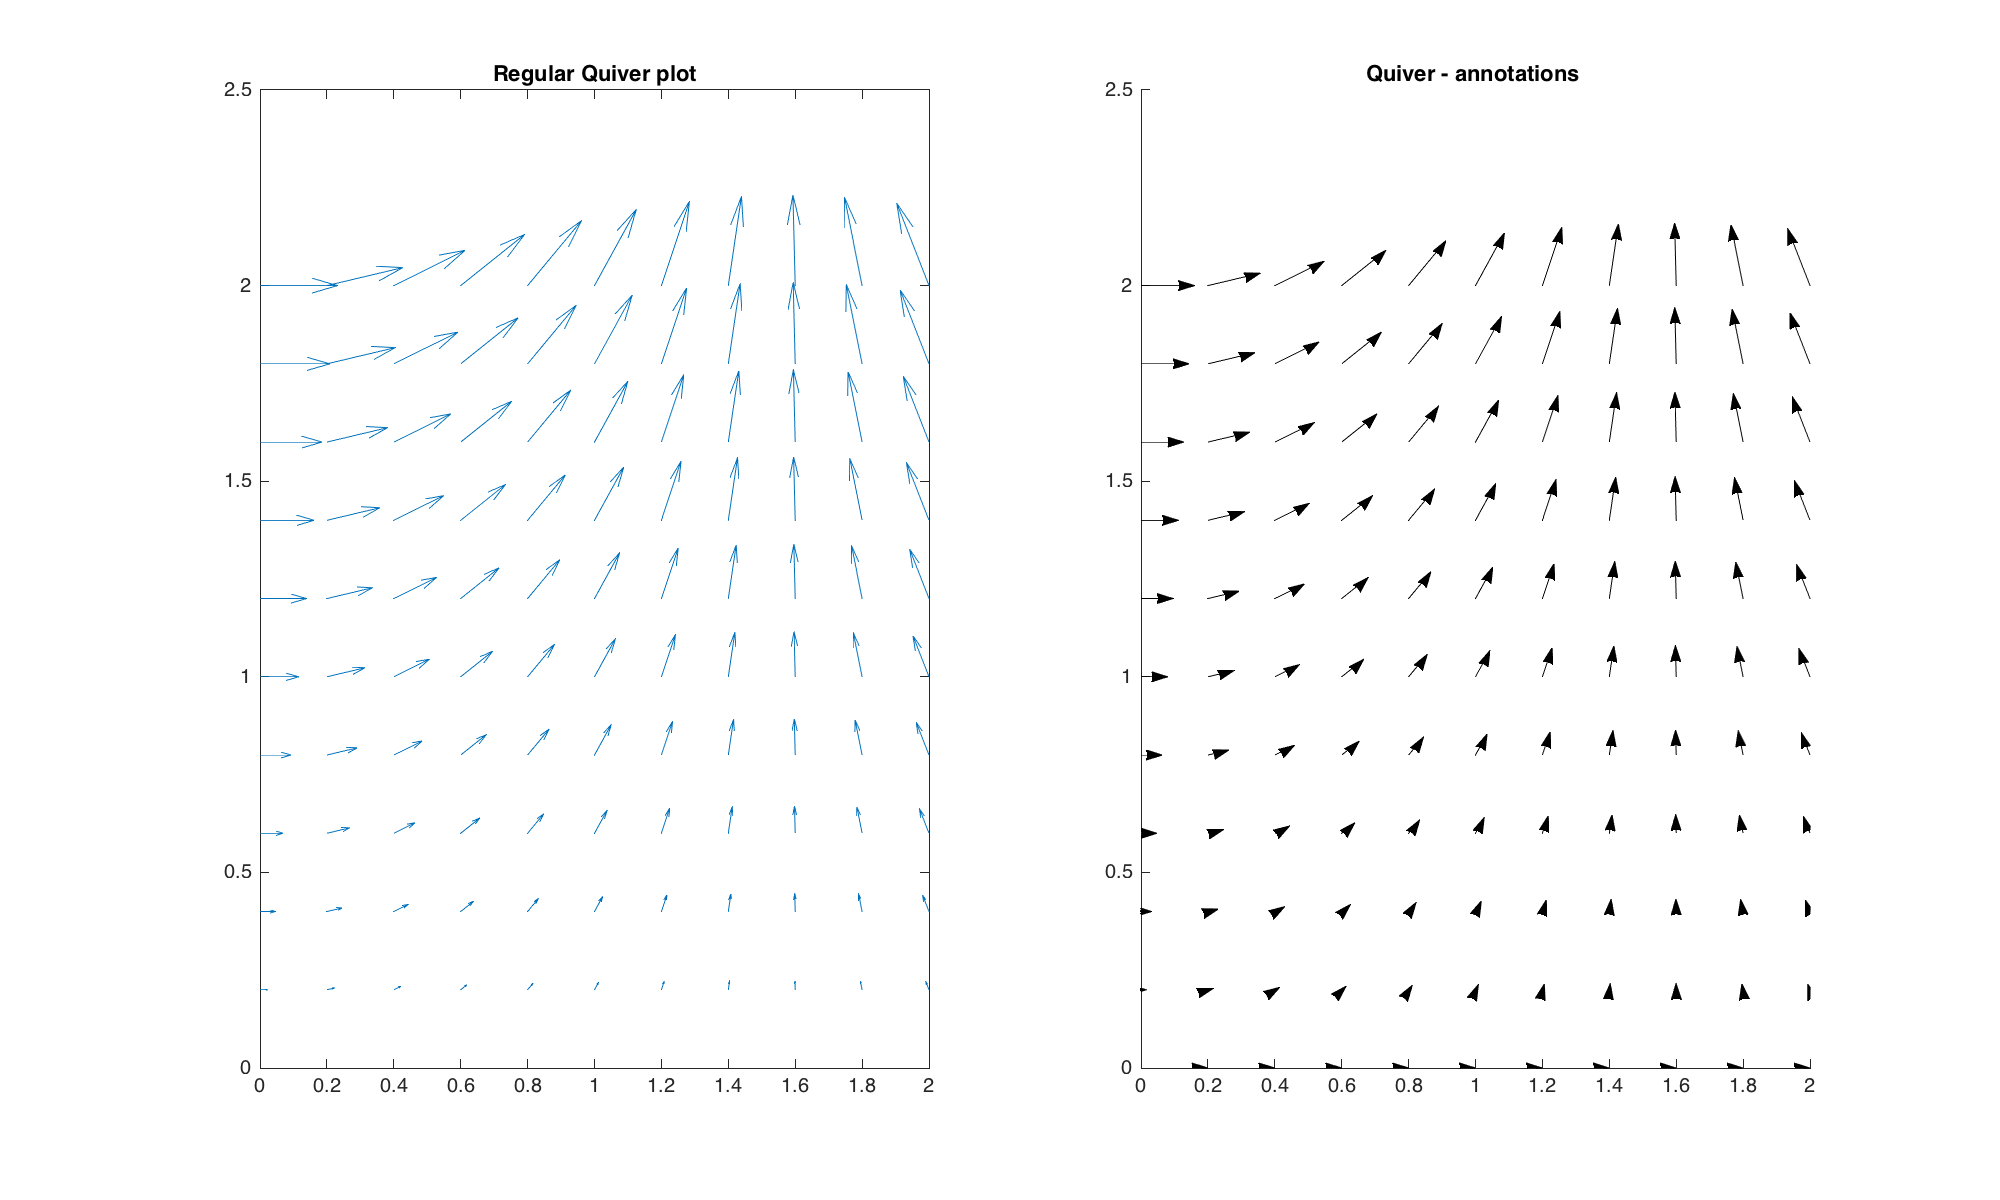
自R2014b版本以来,Matlab对图形组件的结构进行了修改。下面是使用Matlab注释的最新代码。
是由
headWidth = 8;
headLength = 8;
LineLength = 0.08;

%some data
[x,y] = meshgrid(0:0.2:2,0:0.2:2);
u = cos(x).*y;
v = sin(x).*y;

%quiver plots
figure('Position',[10 10 1000 600],'Color','w');
hax_1 = subplot(1,2,1);
hq = quiver(x,y,u,v);           %get the handle of quiver
title('Regular Quiver plot','FontSize',16);

%get the data from regular quiver
U = hq.UData;
V = hq.VData;
X = hq.XData;
Y = hq.YData;

%right version (with annotation)
hax_2 = subplot(1,2,2);
%hold on;
for ii = 1:length(X)
    for ij = 1:length(X)

        headWidth = 5;
        ah = annotation('arrow',...
            'headStyle','cback1','HeadLength',headLength,'HeadWidth',headWidth);
        set(ah,'parent',gca);
        set(ah,'position',[X(ii,ij) Y(ii,ij) LineLength*U(ii,ij) LineLength*V(ii,ij)]);

    end
end
%axis off;
title('Quiver - annotations ','FontSize',16);

linkaxes([hax_1 hax_2],'xy');
请注意,这段代码更改了标题样式和行长的控件(在左侧面板中,您可以看到箭头重叠在左子图的左上角部分,而不是在右侧子图上)。箭头的长度和宽度不被修改。
对于这个编辑,我没有保留为角度编码的颜色方案,并放弃了动态头部大小。让事情变得更清楚了。
Matlab版本的< R2014b
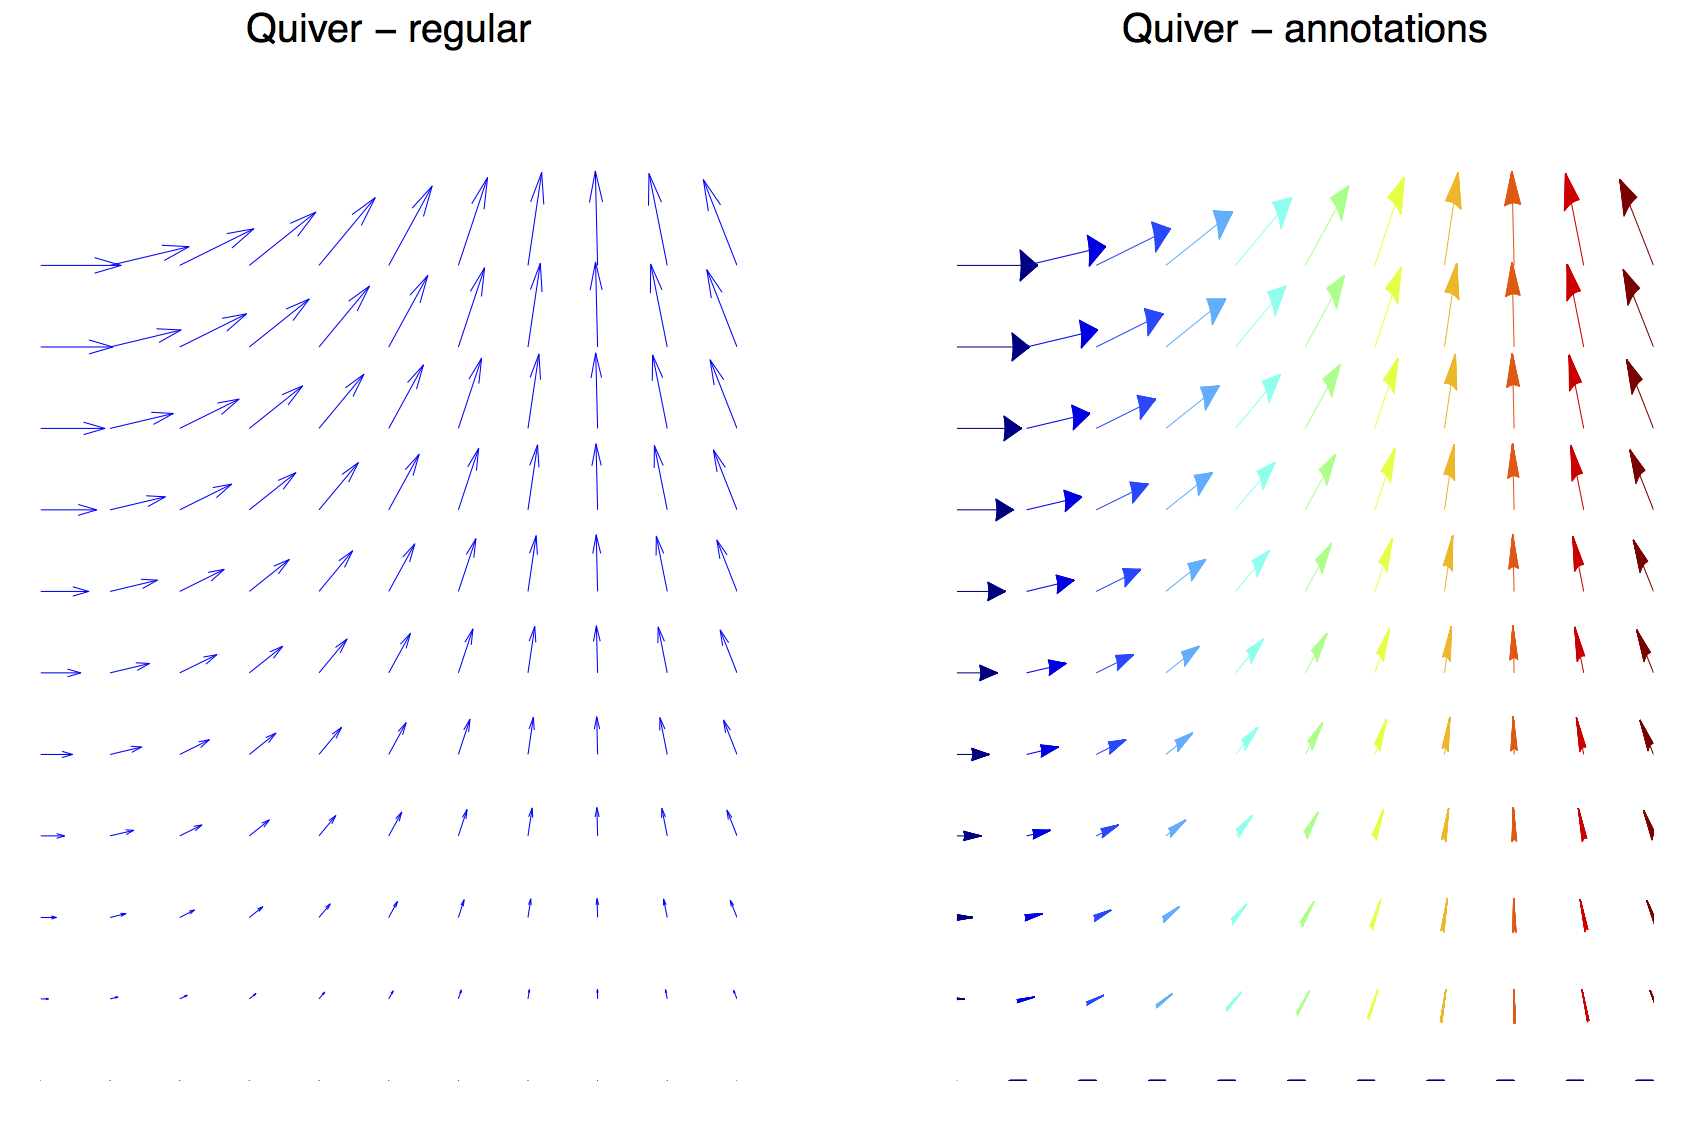
颤抖的情节很难修改。正如@Luis所说,您可以在matlab安装中修改quiver函数。但是,您仍然会受到编程绘制箭头的复杂性的限制,这些箭头具有很好的补丁/行。使用annotation可能有一种更简单的方法--请参阅将headStyle属性设置为cback1的"Quiver -注释“子图。
注解是图形对象(行、文本框、箭头、.)一旦一个情节完成,你就可以很容易地用手插入。例如,它们显示额外的文本或指向特定区域。您也可以通过定义它们的位置来以编程方式插入它们--这是我们将采取的选项。我们首先绘制一个常规的quiver图(左面板),获取蓝线的X和Y数据,并使用这些坐标插入注释箭头,每个箭头都显示在完全相同的位置(相同的位置、相同的角度、相同的大小;右侧面板)。
注释箭头具有一些您可以轻松修改的很好的属性,例如Color、HeadWidth、HeadLength和HeadStyle。在下面的图中,我修改了每个箭头的颜色,这取决于箭头对x轴的角度,以及依赖长度的headWidth。
以下图片
是由
%some data
[x,y] = meshgrid(0:0.2:2,0:0.2:2);
u = cos(x).*y;
v = sin(x).*y;

%quiver plots
figure('Position',[10 10 1000 600],'Color','w');
hax_1 = subplot(1,2,1);

%left version (regular)
hq1 = quiver(x,y,u,v);

%get the line position (first handle)
hkid = get(hq1,'children');
X = get(hkid(1),'XData');
Y = get(hkid(1),'YData');
axis off;
title('Quiver - regular ','FontSize',16);

%right version (with annotation)
hax_2 = subplot(1,2,2);
cmap = jet(116); %colormap, 116 because angles goes up to 115 degrees

for ii = 1:3:length(X)-1

    headWidth = 200 * sqrt((X(ii+1)-X(ii)).^2 + (Y(ii+1)-Y(ii)).^2); % set the headWidth, function of length of arrow
    angled = floor(atan2(Y(ii+1)-Y(ii),X(ii+1)-X(ii))*180/pi) + 1; %get the angle
    ah = annotation('arrow',...
        'Color', cmap(angled,:),...
        'headStyle','cback1','HeadLength',50,'HeadWidth',headWidth);
    set(ah,'parent',gca);
    set(ah,'position',[X(ii) Y(ii) X(ii+1)-X(ii) Y(ii+1)-Y(ii)]);
end
axis off;
title('Quiver - annotations ','FontSize',16);

linkaxes([hax_1 hax_2],'xy');Stack Overflow用户
发布于 2013-09-13 00:26:47
位于...\MATLAB\...\toolbox\matlab\specgraph\@specgraph\@quivergroup\@quivergroup文件夹中的文件...\MATLAB\...\toolbox\matlab\specgraph\@specgraph\@quivergroup\@quivergroup包含以下行:
%// Arrow head parameters
alpha = .33;  %// Size of arrow head relative to the length of the vector
beta = .25; %// Width of the base of the arrow head relative to the length改变alpha和beta值达到了预期的效果。
但是,这需要修改Matlab的文件,因此不建议修改。如果这样做,保存原始refresh.m文件的副本。
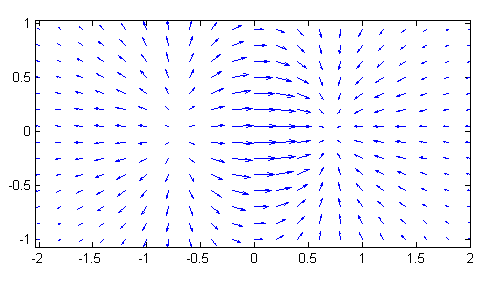
结果使用quiver的帮助中显示的示例代码:
[x,y] = meshgrid(-2:.2:2,-1:.15:1);
z = x .* exp(-x.^2 - y.^2); [px,py] = gradient(z,.2,.15);
quiver(x,y,px,py), hold off, axis image- 具有原始参数(
alpha = .33;beta = .25;):
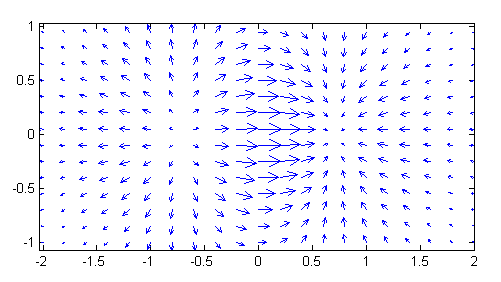
- 与
alpha = .5;beta = .5;
Stack Overflow用户
发布于 2013-09-13 00:26:15
你可以从这里开始:
http://www.mathworks.com/help/matlab/ref/quiver.html
然后,您可以在这里查找quiver的可用属性:
http://www.mathworks.com/help/matlab/ref/quivergroupproperties.html
例如,属性MaxHeadSize允许更改箭头的大小。
编辑:链接中的详细信息:箭头特性
在底部读,在哪里说
您可以选择一个注释,然后选择Show代码来获得一个代码片段,您可以在函数或脚本中插入代码片段来再现注释。
https://stackoverflow.com/questions/18776172
复制相似问题
腾讯云开发者

Copyright © 2013 - 2026 Tencent Cloud. All Rights Reserved. 腾讯云 版权所有
深圳市腾讯计算机系统有限公司 ICP备案/许可证号:粤B2-20090059 ![]() 粤公网安备44030502008569号
粤公网安备44030502008569号
腾讯云计算(北京)有限责任公司 京ICP证150476号 | 京ICP备11018762号