
如何调整matplotlib图例框的大小
如何调整matplotlib图例框的大小
提问于 2013-11-18 12:55:57
我有一张左上角很空白的图。所以我决定把我的传奇盒放在那里。
然而,我发现图例中的项非常小,而图例框本身的也是相当小的。
所谓“小”,是指这样的东西。
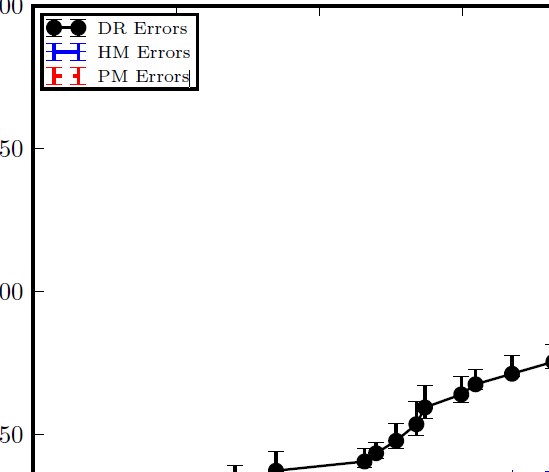
如何使图例框中的项目(而不是texts!)变大?
,我怎么才能把盒子变大呢?
回答 2
Stack Overflow用户
回答已采纳
发布于 2013-11-18 13:38:04
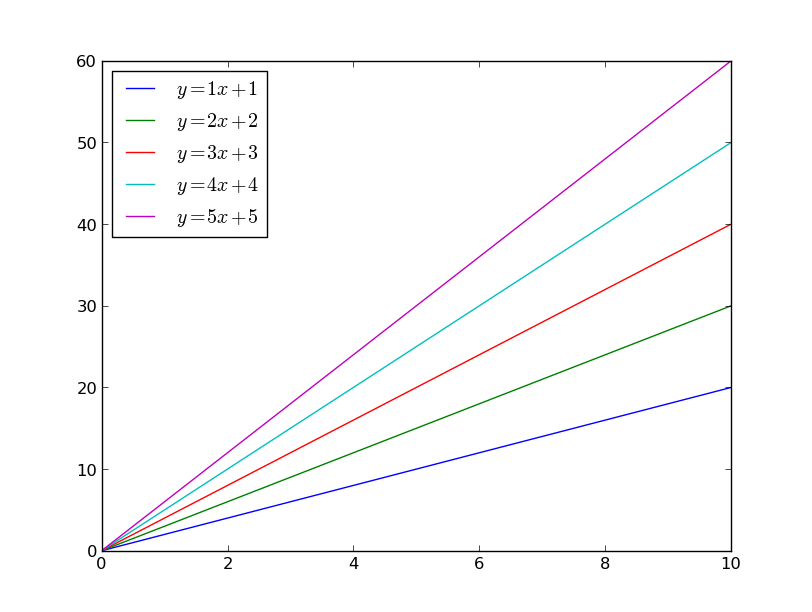
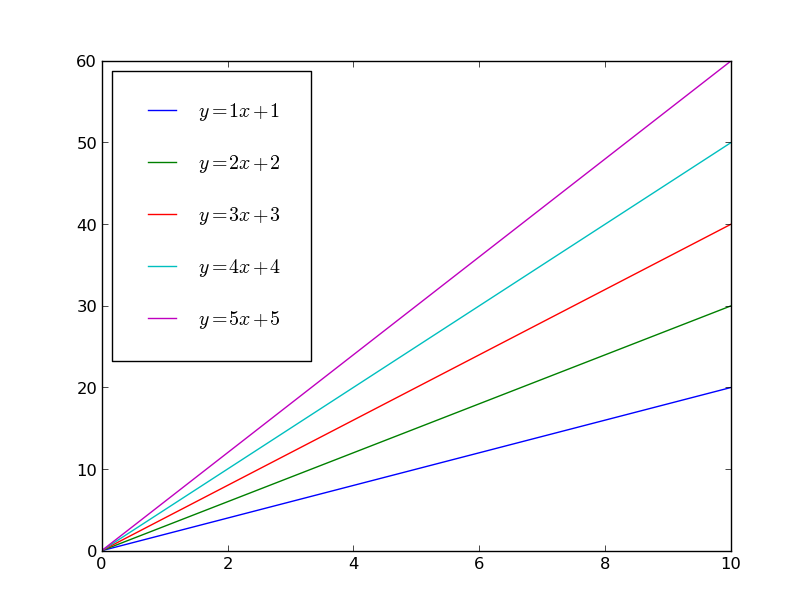
要控制图例内部的填充(有效地使图例框更大),请使用borderpad kwarg。
例如,下面是缺省值:
import matplotlib.pyplot as plt
import numpy as np

x = np.linspace(0, 10, 100)

fig, ax = plt.subplots()
for i in range(1, 6):
    ax.plot(x, i*x + x, label='$y={i}x + {i}$'.format(i=i))
ax.legend(loc='upper left')
plt.show()
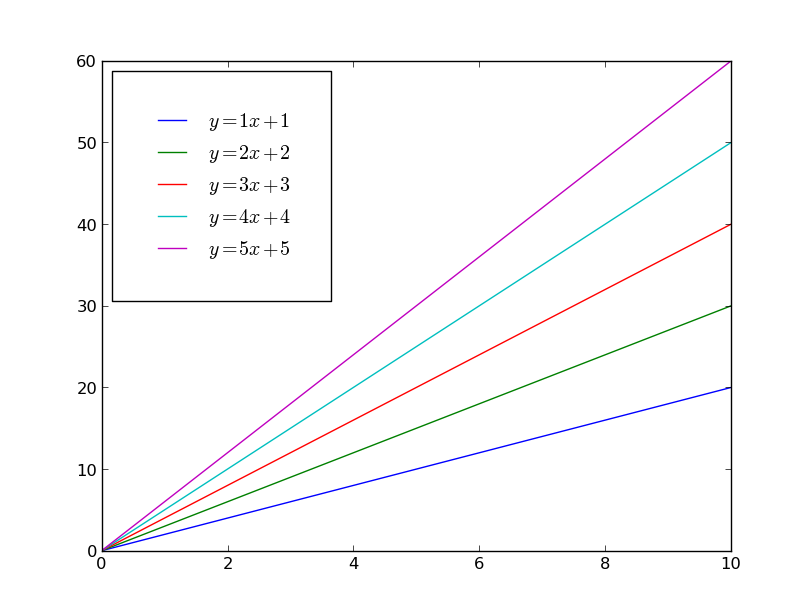
如果我们用borderpad=2填充内部,我们将使整个图例框更大(单位是字体大小的倍数,类似于em):
import matplotlib.pyplot as plt
import numpy as np

x = np.linspace(0, 10, 100)

fig, ax = plt.subplots()
for i in range(1, 6):
    ax.plot(x, i*x + x, label='$y={i}x + {i}$'.format(i=i))
ax.legend(loc='upper left', borderpad=2)
plt.show()
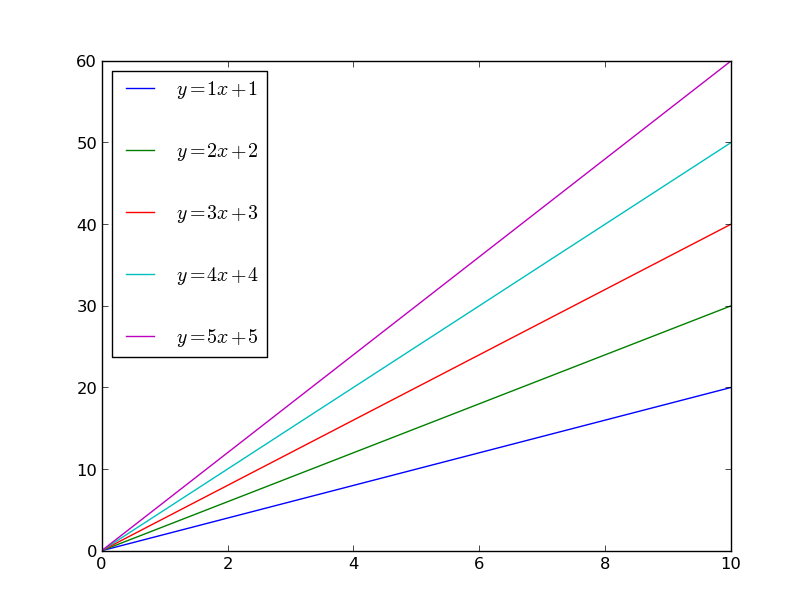
或者,您可能希望更改项目之间的间隔。使用labelspacing来控制这一点:
import matplotlib.pyplot as plt
import numpy as np

x = np.linspace(0, 10, 100)

fig, ax = plt.subplots()
for i in range(1, 6):
    ax.plot(x, i*x + x, label='$y={i}x + {i}$'.format(i=i))
ax.legend(loc='upper left', labelspacing=2)
plt.show()
然而,在大多数情况下,同时调整labelspacing和borderpad是最有意义的:
import matplotlib.pyplot as plt
import numpy as np

x = np.linspace(0, 10, 100)

fig, ax = plt.subplots()
for i in range(1, 6):
    ax.plot(x, i*x + x, label='$y={i}x + {i}$'.format(i=i))
ax.legend(loc='upper left', borderpad=1.5, labelspacing=1.5)
plt.show()
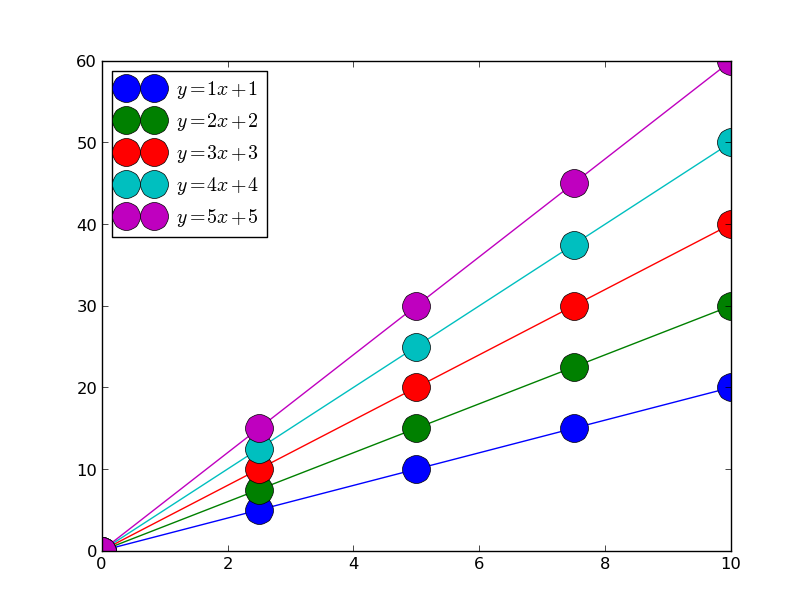
另一方面,如果您有非常大的标记,您可能希望使图例中显示的线的长度更大。例如,默认值可能如下所示:
import matplotlib.pyplot as plt
import numpy as np

x = np.linspace(0, 10, 5)

fig, ax = plt.subplots()
for i in range(1, 6):
    ax.plot(x, i*x + x, marker='o', markersize=20,
            label='$y={i}x + {i}$'.format(i=i))
ax.legend(loc='upper left')
plt.show()
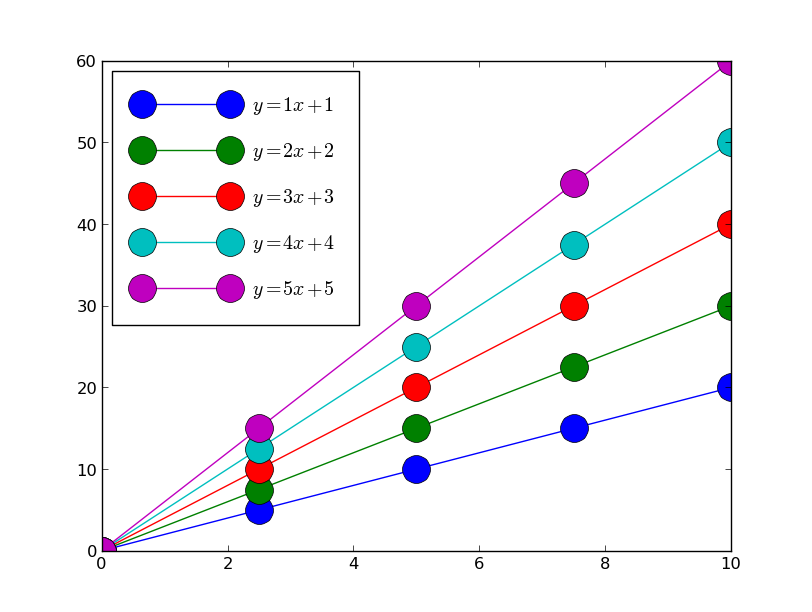
如果我们改变handlelength,我们将得到更长的线在传说中,这看起来更现实一点。(我还在调整borderpad和labelspacing,以便给出更多的空间。)
import matplotlib.pyplot as plt
import numpy as np

x = np.linspace(0, 10, 5)

fig, ax = plt.subplots()
for i in range(1, 6):
    ax.plot(x, i*x + x, marker='o', markersize=20,
            label='$y={i}x + {i}$'.format(i=i))
ax.legend(loc='upper left', handlelength=5, borderpad=1.2, labelspacing=1.2)
plt.show()
在这些文档中,下面是您可能要探讨的其他一些选项:
Padding and spacing between various elements use following
keywords parameters. These values are measure in font-size
units. E.g., a fontsize of 10 points and a handlelength=5
implies a handlelength of 50 points.  Values from rcParams
will be used if None.

=====================================================================
Keyword       |    Description
=====================================================================
borderpad          the fractional whitespace inside the legend border
labelspacing       the vertical space between the legend entries
handlelength       the length of the legend handles
handletextpad      the pad between the legend handle and text
borderaxespad      the pad between the axes and legend border
columnspacing the spacing between columnsStack Overflow用户
发布于 2013-11-18 13:38:16
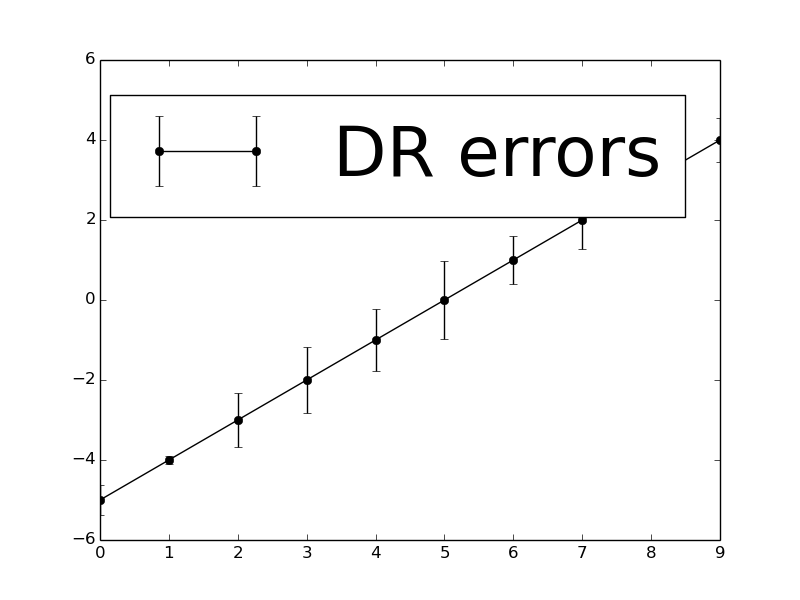
当您调用图例时,可以使用包含大小的prop参数。
plt.errorbar(x, y, yerr=err, fmt='-o', color='k', label = 'DR errors')
plt.legend(prop={'size':50})
例如。
有关图例的更多信息,请参见这里
页面原文内容由Stack Overflow提供。腾讯云小微IT领域专用引擎提供翻译支持
原文链接:
https://stackoverflow.com/questions/20048352
复制相关文章
相似问题
腾讯云开发者
