拟合反函数
拟合反函数
提问于 2013-11-28 12:40:21
我有一个函数,它看起来是: g(x) = f(x) - a^b / f(x)^b
g(x) -已知函数,提供数据向量。
f(x) -隐藏过程。
a,b-这个函数的参数。
从上面我们得到了这样的关系:
f(x) =逆(g(X))
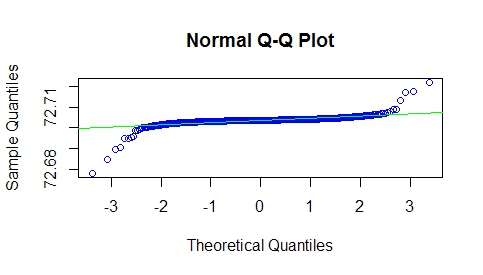
我的目标是优化参数a和b,使f(x)尽可能接近
服从正态分布。如果我们查看f(x) Q-Q正态图(附图),我的目的是通过优化参数a和b,使f(x)到表示正态分布的直线之间的距离最小。
我编写了以下代码:
g_fun <- function(x) {x - a^b/x^b}

inverse = function (f, lower = 0, upper = 2000) {
      function (y) uniroot((function (x) f(x) - y), lower = lower, upper = upper)[1]
}


f_func = inverse(function(x) g_fun(x))
enter code here

# let's made up an example
# g(x) values are known
g <- c(-0.016339, 0.029646, -0.0255258, 0.003352, -0.053258, -0.018971, 0.005172,
       0.067114, 0.026415, 0.051062)

# Calculate f(x) by using the inverse of g(x), when a=a0 and b=b0
for (i in 1:10) {
  f[i] <- f_fun(g[i])
}
我有两个问题:
- 如何将参数a和b传递给函数?
- 如何执行这个优化任务,意味着找到a和b,使f(x)近似于正态分布。
回答 1
Stack Overflow用户
回答已采纳
发布于 2013-12-05 09:31:29
不确定你是如何产生的Q-Q图,因为你提供的例子不起作用。您不是指定a和b的值,而是定义f_func,而是调用f_fun。不管怎么说,这是我对你们问题的回答:
- 如何将参数a和b传递给函数?-只是将它们作为参数传递给函数。
- 如何执行这个优化任务,意思是找到a和b,使f(x)近似于正态分布?-就像完成任何优化任务一样。定义一个成本函数,然后最小化它。
下面是修改后的代码:我添加了a和b作为参数,删除了反函数并将其合并到f_func中,它现在可以接受向量输入,因此不需要for循环。
g_fun <- function(x,a,b) {x - a^b/x^b}

f_func = function(y,a,b,lower = 0, upper = 2000){
  sapply(y,function(z) { uniroot(function(x) g_fun(x,a,b) - z, lower = lower, upper = upper)$root})
}

# g(x) values are known
g <- c(-0.016339, 0.029646, -0.0255258, 0.003352, -0.053258, -0.018971, 0.005172,
       0.067114, 0.026415, 0.051062)
f <- f_func(g,1,1) # using a = 1 and b = 1
#[1] 0.9918427 1.0149329 0.9873386 1.0016774 0.9737270 0.9905320 1.0025893
#[8] 1.0341199 1.0132947 1.0258569

f_func(g,2,10)
 [1] 1.876408 1.880554 1.875578 1.878138 1.873094 1.876170 1.878304 1.884049
 [9] 1.880256 1.882544
对于优化部分,它取决于f(x)近似正态分布的含义。如果你愿意,你可以比较qq线的均方误差.还有,既然你说的是近似,多近就够好了?您可以使用shapiro.test继续搜索,直到找到低于0.05的p值(请注意,可能没有解决方案)。
shapiro.test(f_func(g,1,2))$p
[1] 0.9484821

cost <- function(x,y) shapiro.test(f_func(g,x,y))$p
既然我们有了一个成本函数,我们该如何把它最小化。进行数值优化的方法有很多种。看看optim http://stat.ethz.ch/R-manual/R-patched/library/stats/html/optim.html。
optim(c(1,1),cost)这最后一行不工作,但没有适当的数据和上下文,这是我所能做的。希望这能有所帮助。
页面原文内容由Stack Overflow提供。腾讯云小微IT领域专用引擎提供翻译支持
原文链接:
https://stackoverflow.com/questions/20266501
复制相关文章
相似问题
腾讯云开发者
