
时间数据的ggplot2和chron scale_x_chron
时间数据的ggplot2和chron scale_x_chron
提问于 2014-03-13 11:57:45
我有很多次,想在一个酒吧里画出每一次的频率。
library(ggplot2)
library(chron)
test <- data.frame(times = c(rep("7:00:00",4), rep("8:00:00",3),
                         rep("12:00:00",1), rep("13:00:00",5)))
test$times <- times(test$times)
test
      times
1  07:00:00
2  07:00:00
3  07:00:00
4  07:00:00
5  08:00:00
6  08:00:00
7  08:00:00
8  12:00:00
9  13:00:00
10 13:00:00
11 13:00:00
12 13:00:00
13 13:00:00选择binwidth的值来表示分钟
p <- ggplot(test, aes(x = times)) + geom_bar(binwidth=1/24/60)
p + scale_x_chron(format="%H:%M")
正如你所看到的,x轴上的刻度是加一个小时的:
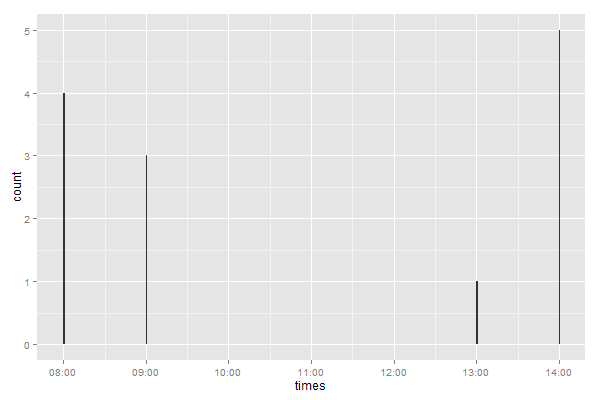
我有一种与时区有关的感觉,但我真的无法放置它:
Sys.timezone()
[1] "CET"
编辑:谢谢您的评论
更新:
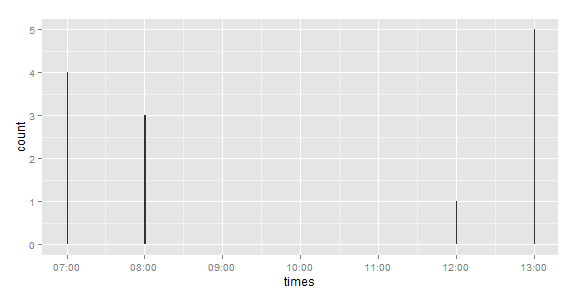
如果我先运行Sys.setenv(TZ='GMT'),它就会运行得非常完美。问题在times()函数中。我会自动将时区设置为GMT,如果我正在绘制x轴,ggplot会注意到我的系统时区是CET,并在绘图上添加了一个小时。现在,如果我将我的系统时区设置为GMT,ggplot不会增加一个小时。
回答 2
Stack Overflow用户
回答已采纳
发布于 2014-03-13 16:47:58
问题是,times(...)假定时区是GMT,然后ggplot对实际时区进行补偿。这很公平:除非您指定时区,否则时间是没有意义的。更大的问题是,似乎不可能告诉times(...)实际的时区是什么(如果其他人知道如何做到这一点,我很想知道)。
解决办法是使用POSIXct并识别您的时区(我的是EST)。
test <- data.frame(times = c(rep("7:00:00",4), rep("8:00:00",3),
                             rep("12:00:00",1), rep("13:00:00",5)))
test$times <- as.POSIXct(test$times,format="%H:%M:%S",tz="EST")
p <- ggplot(test, aes(x = times)) + geom_bar(binwidth=60,width=.01)
binwidth=60是60秒。
Stack Overflow用户
发布于 2014-03-13 12:58:37
它与时区无关,唯一的问题是在format中,%m代表月份,%M代表分钟。因此,下面的内容将有效
p + scale_x_chron(format="%H:%M") 页面原文内容由Stack Overflow提供。腾讯云小微IT领域专用引擎提供翻译支持
原文链接:
https://stackoverflow.com/questions/22377913
复制相关文章
相似问题
腾讯云开发者
