
用ape绘制R中的相同序列
用ape绘制R中的相同序列
提问于 2014-04-02 00:11:26
你好,我有系统发育树的深层测序数据。问题是,很多序列是相同的,所以我想让那些有x个相同序列的节点用一个大小为x的圆来表示,这在R中很容易用APE软件包来表示。问题是,我有两组序列,我想要不同的颜色。例如,在节点1,30%的相同序列来自第1组,70%来自第2组。理想情况下,节点上的这些圆圈实际上是饼形图,显示不同的表示,但我不知道如何计算矢量来喂养猿。有什么想法吗?
回答 1
Stack Overflow用户
回答已采纳
发布于 2014-04-02 07:13:07
使用一个简单的例子:
owl <- read.tree(text="owls(((Strix_aluco:4.2,Asio_otus:4.2):3.1,Athene_noctua:7.3):6.3,Tyto_alba:13.5);")
piedata <- cbind(c(10,50,75),c(90,50,25))
你需要的是:
1)知道节点的坐标
2)能够在现有地块中绘制饼图
对于第一部分,plot.phylo碰巧将所使用的坐标保存在内存中:
plot(owl)
owl.info <- get("last_plot.phylo", envir = .PlotPhyloEnv)
str(owl.info)
List of 20
 $ type           : chr "phylogram"
 $ use.edge.length: logi TRUE
 $ node.pos       : num 1
 $ show.tip.label : logi TRUE
 $ show.node.label: logi FALSE
 $ font           : num 3
 $ cex            : num 1
 $ adj            : num 0
 $ srt            : num 0
 $ no.margin      : logi FALSE
 $ label.offset   : num 0
 $ x.lim          : num [1:2] 0 17.7
 $ y.lim          : num [1:2] 1 4
 $ direction      : chr "rightwards"
 $ tip.color      : chr "black"
 $ Ntip           : int 4
 $ Nnode          : int 3
 $ edge           : int [1:6, 1:2] 5 6 7 7 6 5 6 7 1 2 ...
 $ xx             : num [1:7] 13.6 13.6 13.6 13.5 0 6.3 9.4
$ yy : num [1:7] 1 2 3 4 3.12 ...xx和yy是tips+nodes的坐标(它们的编号对应于phylo对象的edge元素中的编号)。在这里,我们的内部节点是节点5到7。
对于第二个点包,plotrix附带了一个方便的floating.pie函数。
所以在这里:
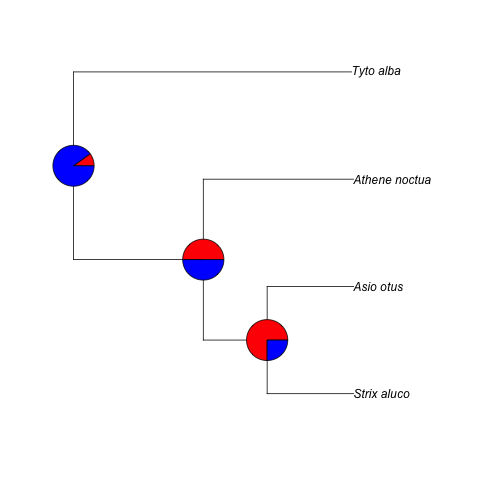
plot(owl)
owl.info <- get("last_plot.phylo", envir = .PlotPhyloEnv)
for(i in 1:nrow(piedata)){
    floating.pie(owl.info$xx[4+i],
                 owl.info$yy[4+i],
                 piedata[i,],
                 col=c("red","blue"),
                 xpd=TRUE)
    }
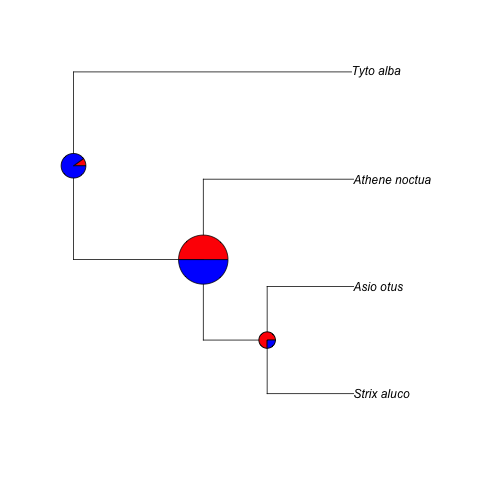
此外,如果您想根据变量x更改饼图的大小:
x <- c(3,6,2)
plot(owl)
owl.info <- get("last_plot.phylo", envir = .PlotPhyloEnv)
for(i in 1:nrow(piedata)){
    floating.pie(owl.info$xx[4+i],
                 owl.info$yy[4+i],
                 piedata[i,],
                 radius=x[i]/5
                 col=c("red","blue"),
                 xpd=TRUE)
    }
页面原文内容由Stack Overflow提供。腾讯云小微IT领域专用引擎提供翻译支持
原文链接:
https://stackoverflow.com/questions/22799269
复制相关文章
相似问题
腾讯云开发者
