
java -如何模拟心电图(心电图)
java -如何模拟心电图(心电图)
提问于 2014-04-19 08:43:37
我正在做一个项目,其中包括模拟心电图(心电图)。我是通过在间隔之间生成一些随机数来实现的,然后将这些数据发送给另一个程序,分析并绘制它。但是,问题是由java代码产生的a,b区间之间产生的随机数有很大的方差,这意味着下一个产生的随机值与前一个数有很大的不同。我想要的是随机数的流动,变化很小,所以图看起来很光滑。在这一点上,产生的图形是非常尖峰,但我希望它是平滑的,变化像一个真正的心电图图。
请帮我做这个。

这是代码
//setup ECG graph
        StdDraw.setXscale(0.0, 100.0);
        StdDraw.setYscale(0.0,200.0);
        StdDraw.setPenColor(StdDraw.BLUE);
        StdDraw.setPenRadius(0.0009);
        //generate random points between interval of range
        int t = 0;

        int prevVal = 0;
        int nextVal;
        while(true){

            nextVal = range.getRandomValue();
            System.out.println(nextVal);

            StdDraw.point(prevVal, nextVal);
            StdDraw.line(t-1, prevVal, t, nextVal);

            StdDraw.show(100);

            prevVal = nextVal;
            t = (t+1) % 100;
            if(t == 0){
                StdDraw.clear();

            }
        }
谢谢
回答 1
Stack Overflow用户
回答已采纳
发布于 2014-04-19 08:58:34
为什么不尝试用sin(t)函数来调制随机信号:
long n = 0;

double randomWeight = 0.5;

while(true) {

    nextVal = range.getRandomValue();

    double temp = AMPLITUDE*(randomWeight*((double)nextVal)+(1.0-randomWeight)*Math.sin(2.0*Math.PI*((double)n)*WIDTH_FACTOR));


    nextVal = (long)temp;

    n++;

    System.out.println(nextVal);

    StdDraw.point(prevVal, nextVal);
    StdDraw.line(t-1, prevVal, t, nextVal);

    StdDraw.show(100);

    prevVal = nextVal;
    t = (t+1) % 100;
    if(t == 0){
        StdDraw.clear();

}
其思想是产生一个正弦波函数,并在其中加入一些随机噪声。你可能想把这个噪音加到方波中去。我真的不太清楚心电图是什么样子,但我想它一定是由心跳控制的。
编辑:
我刚刚检查了这些信号的外观:
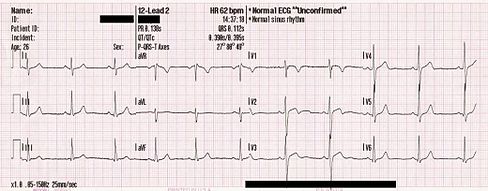
在我看来,一个相对平坦的随机信号会被周期性尖峰打断,从而给出一个更精确的模型:
long n = 0;

while(true) {

    nextVal = range.getRandomValue();
    if(n % SPIKE_PERIOD == 0) nextVal = SPIKE_APLITUDE*nextVal;

    n++;


    System.out.println(nextVal);

    StdDraw.point(prevVal, nextVal);
    StdDraw.line(t-1, prevVal, t, nextVal);

    StdDraw.show(100);

    prevVal = nextVal;
    t = (t+1) % 100;
    if(t == 0){
        StdDraw.clear();

}页面原文内容由Stack Overflow提供。腾讯云小微IT领域专用引擎提供翻译支持
原文链接:
https://stackoverflow.com/questions/23167879
复制相关文章
相似问题
腾讯云开发者
