
在Matlab中绘制网格和赋值箭头
在Matlab中绘制网格和赋值箭头
提问于 2014-05-23 09:15:02
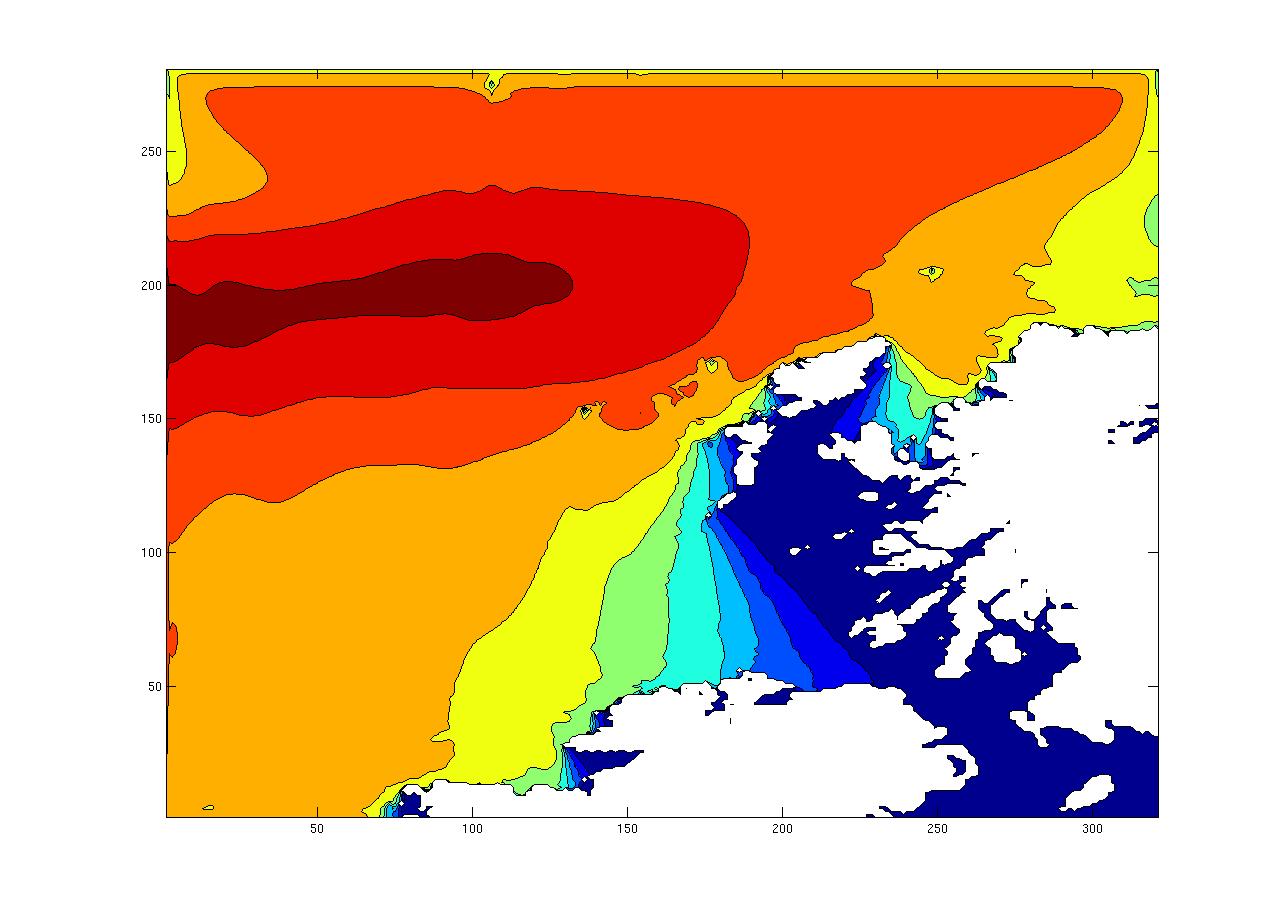
我想把向量赋给等值线图,以显示风的方向和大小。为此,我使用contourf(A)和quiver(x,y),其中A是矩阵151x401,y是大小相同的矩阵(151x401),它们的大小和方向相同。
当我使用大地图时,我得到箭头的位置,但它们要被密集放置,这使得图形看起来很糟糕。
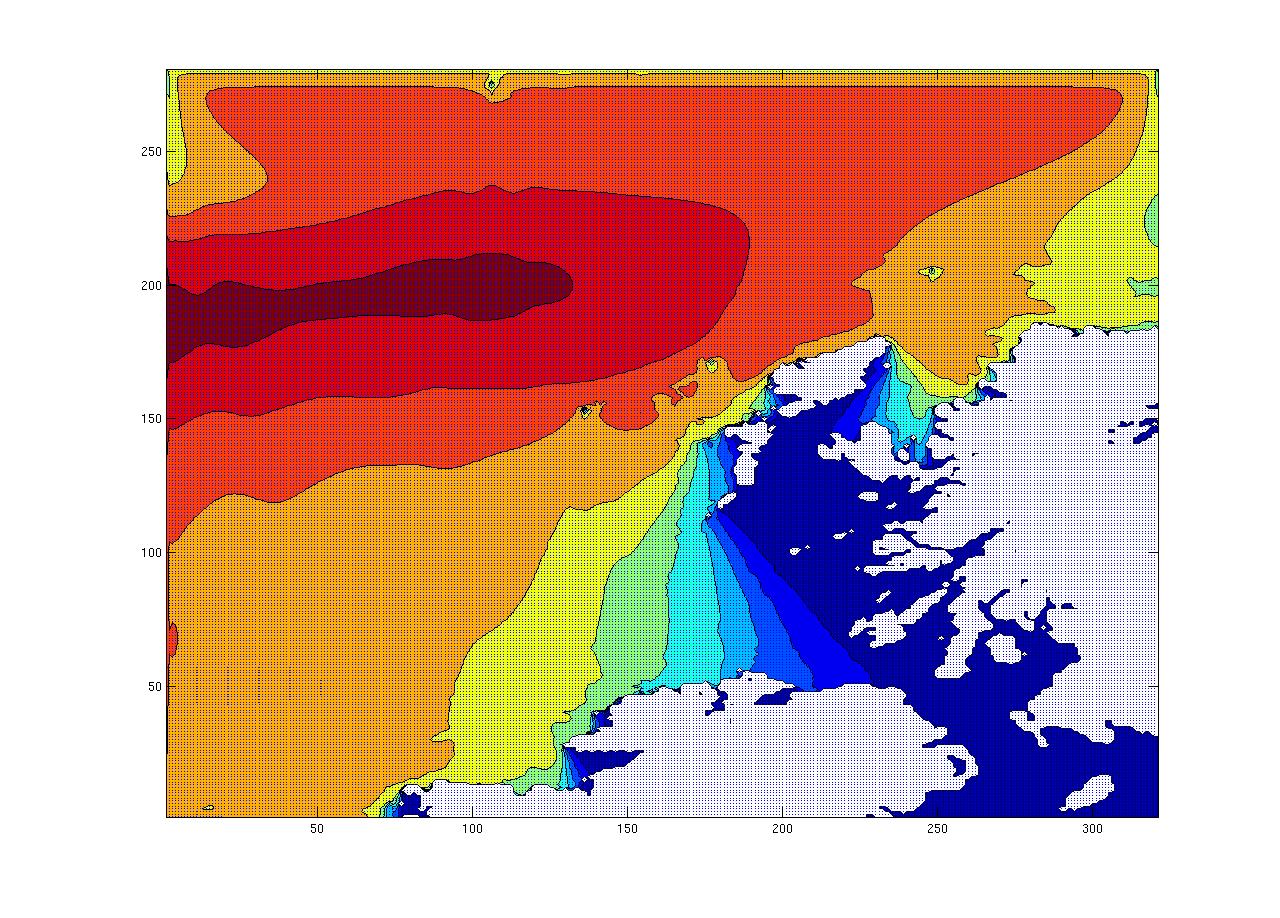
最后一张图有所需的箭头,但它们对许多箭头来说太近了,我希望它们更加稀少,分布得更大,以便能够增加它们的长度,同时使等高线图的组成部分可见。
有人能帮忙吗,任何指点都会有帮助
回答 1
Stack Overflow用户
回答已采纳
发布于 2014-08-19 14:05:09
我知道这个问题被问了很久了,但我想我找到了一个办法来解决这个问题。如果有人遇到同样的问题,我会附加代码
[nx,ny]= size(A) % A is the matrix used as base
xx=1:1:ny; % set the x-axis to be equal to the y
yy=1:1:nx; % set the y-axis to be equal to the x
contourf(xx,yy,A)
hold on, delta = 8; %delta is the distance between arrows)
quiver(xx(1:delta:end),yy(1:delta:end),B(1:delta:end,1:delta:end),C(1:delta:end,1:delta:end),1) % the 1 at the end is the size of the arrows
set(gca,'fontsize',12);, hold off
A,B,C是对应的矩阵
页面原文内容由Stack Overflow提供。腾讯云小微IT领域专用引擎提供翻译支持
原文链接:
https://stackoverflow.com/questions/23825299
复制相关文章
相似问题
腾讯云开发者
