
Matplotlib pcolormesh,单独的数据颜色和颜色亮度信息
Matplotlib pcolormesh,单独的数据颜色和颜色亮度信息
提问于 2014-06-02 23:29:12
我想用matplotlib在网格上绘制数据,目前正在尝试pcolormesh。数据组织在两个numpy数组中,数据本身和一个colorInformation数组。
下面的代码绘制了数据数组(1是红色的,0的是蓝色的),但是我也有一个colorInformation数组,它应该根据其值改变每个相应单元格的亮度,同时保持颜色。
例如,数据中的第1行、第0行、第0行、第1行的亮度值应该是0.1、0.12、0.02、0.01,这样这一行就可以可视化为红色和亮度0.1、蓝色和亮度0.12、蓝色和亮度0.02、红色和亮度0.01。
如何才能做到这一点?
import numpy as np
import matplotlib.pyplot as plt

data = np.array([[1, 0, 0, 1],
                 [0, 0, 1, 1],
                 [0, 0, 0, 1]])
colorInformation = np.array([[0.1, 0.12, 0.02, 0.01],
                             [0.12, 0.15, 0.18, 0.2],
                             [0.3, 0.34, 0.41, 0.32]])

fig, ax = plt.subplots()
heatmap = ax.pcolormesh(data)
plt.show()回答 1
Stack Overflow用户
回答已采纳
发布于 2014-06-04 21:25:13
我建议让你自己定制颜色图来解决这个问题。
from matplotlib.colors import LinearSegmentedColormap
data = np.array([[1, 0, 0, 1],
                 [0, 0, 1, 1],
                 [0, 0, 0, 1]])
colorInformation = np.array([[0.1, 0.12, 0.02, 0.01],
                             [0.12, 0.15, 0.18, 0.2],
                             [0.3, 0.34, 0.41, 0.32]])
alpha_up=abs(((data*2-1)*colorInformation).max())
alpha_low=abs(((data*2-1)*colorInformation).min())
mid=alpha_low/(alpha_up+alpha_low)
cdict1 = {'red':   ((0.0, 1.0, 1.0),
                   (mid, 1.0, 0.0),
                   (1.0, 0.0, 0.0)),

         'green': ((0.0, 0.0, 0.0),
                   (1.0, 0.0, 0.0)),

         'blue':  ((0.0, 0.0, 0.0),
                   (mid, 0.0, 1.0),
                   (1.0, 1.0, 1.0)),

         'alpha':  ((0.0, alpha_low, alpha_low),
                   (mid, 0.0, 0.0),
                   (1.0, alpha_up, alpha_up))
        }
red_blue = LinearSegmentedColormap('red_blue', cdict1)
fig, ax = plt.subplots()
heatmap = ax.pcolormesh((data*2-1)*colorInformation, cmap=red_blue)
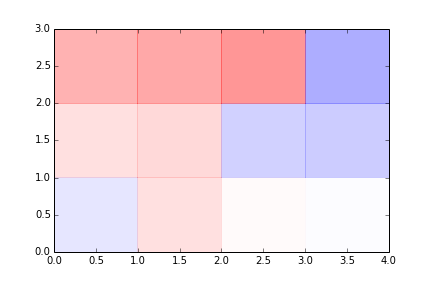
或者你只需改变红色和蓝色,而不使用alpha通道。
页面原文内容由Stack Overflow提供。腾讯云小微IT领域专用引擎提供翻译支持
原文链接:
https://stackoverflow.com/questions/24004887
复制相关文章
相似问题
腾讯云开发者
